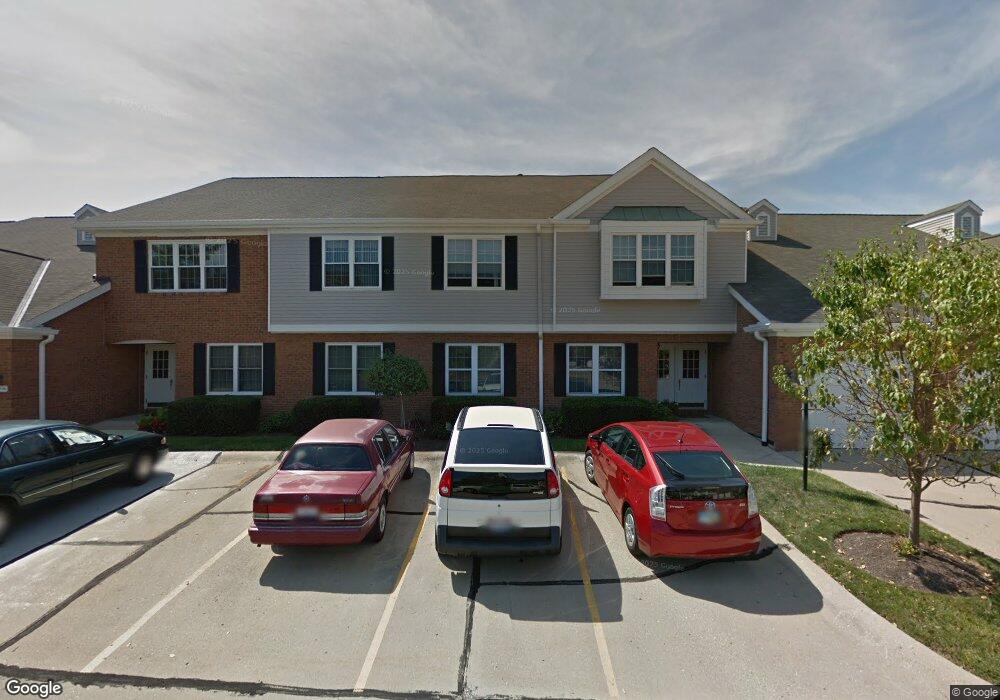
6585 Chesapeake Run Cincinnati, OH 45248
Estimated Value: $201,072 - $230,000
2
Beds
2
Baths
1,356
Sq Ft
$157/Sq Ft
Est. Value
About This Home
This home is located at 6585 Chesapeake Run, Cincinnati, OH 45248 and is currently estimated at $213,018, approximately $157 per square foot. 6585 Chesapeake Run is a home located in Hamilton County with nearby schools including Charles W Springmyer Elementary School, Bridgetown Middle School, and Oak Hills High School.
Ownership History
Date
Name
Owned For
Owner Type
Purchase Details
Closed on
Mar 11, 2021
Sold by
Komau Joseph P
Bought by
Komau Elizabeth Beucler and The Elizabeth Beucler Komau Tr
Current Estimated Value
Purchase Details
Closed on
Apr 16, 2009
Sold by
Keilholz Tamblyn Margaret
Bought by
Kornau Joseph P
Home Financials for this Owner
Home Financials are based on the most recent Mortgage that was taken out on this home.
Original Mortgage
$114,300
Interest Rate
5.05%
Mortgage Type
Purchase Money Mortgage
Purchase Details
Closed on
Jun 26, 2004
Sold by
Keilholz Margaret C and Keilholz Tamblyn Margaret
Bought by
Keilholz Tamblyn Margaret and The Margaret Keilholz Tamblyn Trust
Purchase Details
Closed on
May 8, 1995
Sold by
Messerschmitt Donna L
Bought by
Obanion Lola and Obanion Douglas W
Create a Home Valuation Report for This Property
The Home Valuation Report is an in-depth analysis detailing your home's value as well as a comparison with similar homes in the area
Home Values in the Area
Average Home Value in this Area
Purchase History
| Date | Buyer | Sale Price | Title Company |
|---|---|---|---|
| Komau Elizabeth Beucler | $132,000 | None Available | |
| Kornau Joseph P | $127,000 | Attorney | |
| Keilholz Tamblyn Margaret | -- | -- | |
| Obanion Lola | -- | -- |
Source: Public Records
Mortgage History
| Date | Status | Borrower | Loan Amount |
|---|---|---|---|
| Previous Owner | Kornau Joseph P | $114,300 |
Source: Public Records
Tax History Compared to Growth
Tax History
| Year | Tax Paid | Tax Assessment Tax Assessment Total Assessment is a certain percentage of the fair market value that is determined by local assessors to be the total taxable value of land and additions on the property. | Land | Improvement |
|---|---|---|---|---|
| 2024 | $2,819 | $55,552 | $7,875 | $47,677 |
| 2023 | $2,822 | $55,552 | $7,875 | $47,677 |
| 2022 | $2,021 | $33,702 | $7,000 | $26,702 |
| 2021 | $1,815 | $33,702 | $7,000 | $26,702 |
| 2020 | $1,838 | $33,702 | $7,000 | $26,702 |
| 2019 | $2,053 | $34,353 | $7,000 | $27,353 |
| 2018 | $2,056 | $34,353 | $7,000 | $27,353 |
| 2017 | $1,937 | $34,353 | $7,000 | $27,353 |
| 2016 | $2,083 | $36,894 | $5,810 | $31,084 |
| 2015 | $2,101 | $36,894 | $5,810 | $31,084 |
| 2014 | $2,104 | $36,894 | $5,810 | $31,084 |
| 2013 | $2,367 | $44,450 | $7,000 | $37,450 |
Source: Public Records
Map
Nearby Homes
- 6537 Chesapeake Run
- 6604 Hearne Rd
- 6588 Hearne Rd
- 5207 S Eaglesnest Dr
- 6989 Carlinridge Ln
- 4870 Highland Oaks Dr
- 6580 Hearne Rd
- 6745 Legacy Ridge Ln
- 6521 Greenoak Dr
- 5185 Wesselman Woods Dr
- 10 Priya Place
- 6419 Louese Ln
- 6831 Wesselman Rd
- 5423 Bluesky Dr
- 6953 Carlinridge Ln
- SHELBURN Plan at Janson Woods
- BRENNAN Plan at Janson Woods
- STRATTON Plan at Janson Woods
- QUENTIN Plan at Janson Woods
- VANDERBURGH Plan at Janson Woods
- 6587 Chesapeake Run
- 6587 Chesapeake Run Unit 169
- 6583 Chesapeake Run
- 6581 Chesapeake Run Unit 170
- 6571 Chesapeake Run
- 6573 Chesapeake Run
- 6579 Chesapeake Run
- 6575 Chesapeake Run
- 6577 Chesapeake Run
- 5105 Carriage Hill
- 5107 Carriage Hill Unit 155
- 5101 Carriage Hill Unit 153
- 5115 Carriage Hill
- 5103 Carriage Hill
- 6193 Eagles Lake Ct
- 5109 Carriage Hill
- 6567 Chesapeake Run
- 5113 Carriage Hill
- 5111 Carriage Hill Unit 160
- 6565 Chesapeake Run Unit 191