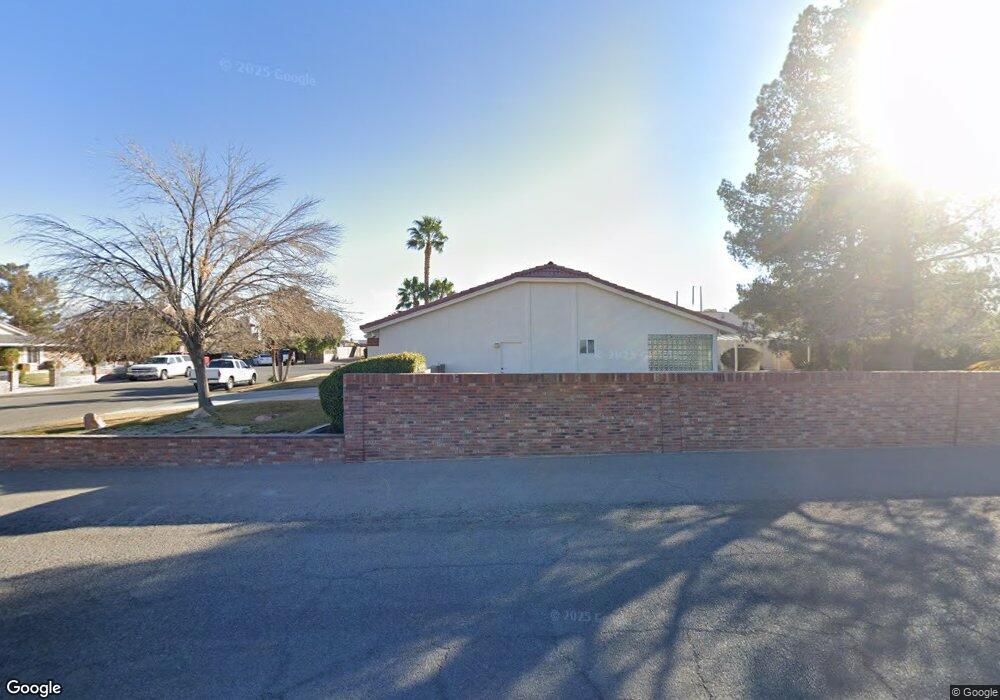
6585 W Oquendo Rd Las Vegas, NV 89118
Estimated Value: $720,203 - $849,000
3
Beds
3
Baths
2,512
Sq Ft
$320/Sq Ft
Est. Value
About This Home
This home is located at 6585 W Oquendo Rd, Las Vegas, NV 89118 and is currently estimated at $803,801, approximately $319 per square foot. 6585 W Oquendo Rd is a home located in Clark County with nearby schools including Marion B Earl Elementary School, Grant Sawyer Middle School, and Durango High School.
Ownership History
Date
Name
Owned For
Owner Type
Purchase Details
Closed on
Apr 10, 2008
Sold by
Zymanek Kenneth Michael
Bought by
Zymanek Kenneth Michael
Current Estimated Value
Home Financials for this Owner
Home Financials are based on the most recent Mortgage that was taken out on this home.
Original Mortgage
$100,000
Interest Rate
6.22%
Mortgage Type
Credit Line Revolving
Purchase Details
Closed on
Jul 20, 2004
Sold by
Zymanek Sandra Marie
Bought by
Zymanek Kenneth Michael
Purchase Details
Closed on
Aug 31, 1999
Sold by
Runyon Gary A and Runyon Jackie P
Bought by
Zymanek Kenneth M and Zymanek Sandra M
Home Financials for this Owner
Home Financials are based on the most recent Mortgage that was taken out on this home.
Original Mortgage
$175,000
Outstanding Balance
$52,160
Interest Rate
7.89%
Estimated Equity
$751,641
Purchase Details
Closed on
Jul 25, 1995
Sold by
Barbee Phillip James
Bought by
Runyon Gary A and Runyon Jackie P
Create a Home Valuation Report for This Property
The Home Valuation Report is an in-depth analysis detailing your home's value as well as a comparison with similar homes in the area
Home Values in the Area
Average Home Value in this Area
Purchase History
| Date | Buyer | Sale Price | Title Company |
|---|---|---|---|
| Zymanek Kenneth Michael | -- | Accommodation | |
| Zymanek Kenneth Michael | -- | -- | |
| Zymanek Kenneth M | $325,000 | National Title Company | |
| Runyon Gary A | $250,000 | Old Republic Title Company |
Source: Public Records
Mortgage History
| Date | Status | Borrower | Loan Amount |
|---|---|---|---|
| Closed | Zymanek Kenneth Michael | $100,000 | |
| Open | Zymanek Kenneth M | $175,000 |
Source: Public Records
Tax History Compared to Growth
Tax History
| Year | Tax Paid | Tax Assessment Tax Assessment Total Assessment is a certain percentage of the fair market value that is determined by local assessors to be the total taxable value of land and additions on the property. | Land | Improvement |
|---|---|---|---|---|
| 2025 | $3,304 | $202,492 | $73,500 | $128,992 |
| 2024 | $3,209 | $202,492 | $73,500 | $128,992 |
| 2023 | $2,349 | $183,879 | $61,250 | $122,629 |
| 2022 | $3,266 | $167,467 | $54,250 | $113,217 |
| 2021 | $3,025 | $157,505 | $49,000 | $108,505 |
| 2020 | $2,806 | $157,392 | $49,000 | $108,392 |
| 2019 | $2,629 | $151,410 | $43,750 | $107,660 |
| 2018 | $2,509 | $144,757 | $40,250 | $104,507 |
| 2017 | $4,181 | $142,547 | $35,000 | $107,547 |
| 2016 | $2,349 | $134,835 | $28,000 | $106,835 |
| 2015 | $2,345 | $122,500 | $26,250 | $96,250 |
| 2014 | $2,276 | $80,041 | $17,500 | $62,541 |
Source: Public Records
Map
Nearby Homes
- 6480 W Oquendo Rd
- 0 W Unit 2633036
- 5669 Steampunk St
- 5652 Redwood St
- 5633 Steampunk St
- 5770 El Camino Rd
- 5877 Steinbeck Valley St
- 5535 Mount Diablo Dr
- 5595 El Camino Rd
- 5603 Deer Creek Falls Ct
- 5568 Yellow Ash St
- 5692 Tinar St
- 5677 Asyma Ct
- 5410 Manteca Cir
- 7058 Baza Ave
- 7086 Parkallen Ave
- 6053 Conroe Ct
- 5341 Bitterwood Ln
- 7232 Deer View Ct
- 5734 Prima St
- 6565 W Oquendo Rd
- 6579 W Oquendo Rd
- 6571 W Oquendo Rd
- 6535 W Oquendo Rd
- 6515 W Oquendo Rd
- 5935 S Torrey Pines Dr
- 6495 W Oquendo Rd
- 5940 S Torrey Pines Dr
- 5860 S Torrey Pines Dr
- 6025 Sorrel St
- 6565 Ponderosa Way
- 6465 W Oquendo Rd
- 6460 W Oquendo Rd
- 6525 Ponderosa Way
- 5885 Redwood St
- 6735 W Oquendo Rd
- 6450 W Oquendo Rd
- 5865 Redwood St
- 6440 W Oquendo Rd
- 6465 W Quail Ave