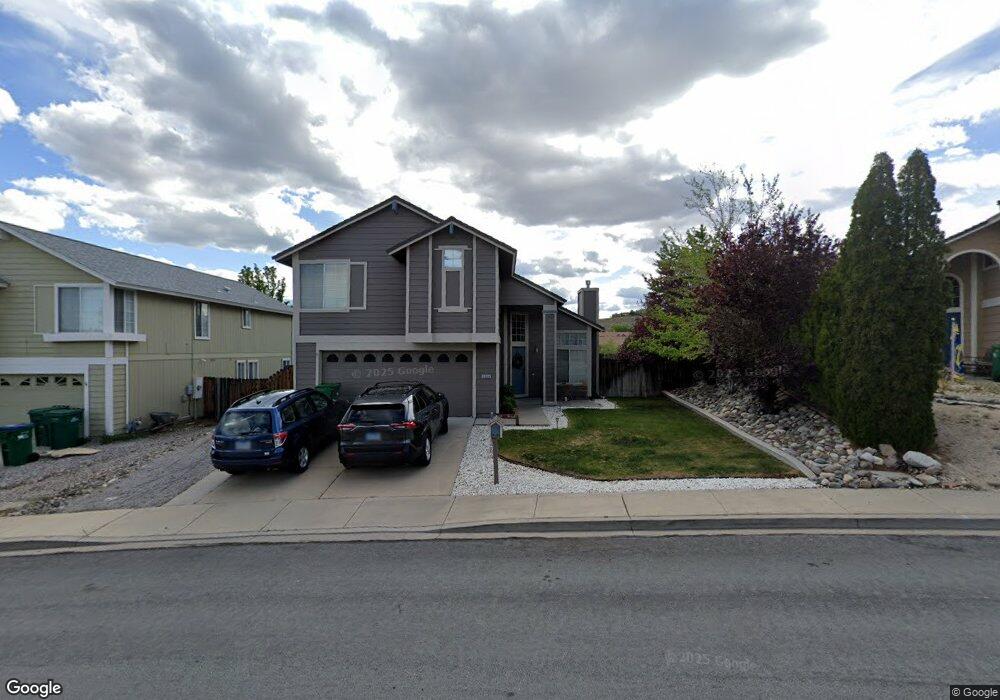
6586 Fall River Cir Reno, NV 89523
Mae Anne Avenue NeighborhoodEstimated Value: $548,000 - $588,000
4
Beds
3
Baths
1,722
Sq Ft
$330/Sq Ft
Est. Value
About This Home
This home is located at 6586 Fall River Cir, Reno, NV 89523 and is currently estimated at $567,753, approximately $329 per square foot. 6586 Fall River Cir is a home located in Washoe County with nearby schools including B D Billinghurst Middle School, Robert McQueen High School, and Riverview Christian Academy.
Ownership History
Date
Name
Owned For
Owner Type
Purchase Details
Closed on
Sep 19, 2014
Sold by
Webbert Jim E and Webbert Maria Carla
Bought by
Webbert Jim E and Webbert Maria Carla
Current Estimated Value
Home Financials for this Owner
Home Financials are based on the most recent Mortgage that was taken out on this home.
Original Mortgage
$229,500
Outstanding Balance
$174,810
Interest Rate
4.16%
Mortgage Type
New Conventional
Estimated Equity
$392,943
Purchase Details
Closed on
Oct 8, 1998
Sold by
Webbert Jimmie E
Bought by
Casas Webbert Carla
Purchase Details
Closed on
Jan 7, 1997
Sold by
Mcgah Dutton and Mcgah Bailey
Bought by
Webbert Jim E and Webbert Carla
Home Financials for this Owner
Home Financials are based on the most recent Mortgage that was taken out on this home.
Original Mortgage
$155,050
Interest Rate
7.53%
Create a Home Valuation Report for This Property
The Home Valuation Report is an in-depth analysis detailing your home's value as well as a comparison with similar homes in the area
Home Values in the Area
Average Home Value in this Area
Purchase History
| Date | Buyer | Sale Price | Title Company |
|---|---|---|---|
| Webbert Jim E | -- | Vantage Point Title | |
| Casas Webbert Carla | -- | -- | |
| Webbert Jim E | $163,500 | Stewart Title |
Source: Public Records
Mortgage History
| Date | Status | Borrower | Loan Amount |
|---|---|---|---|
| Open | Webbert Jim E | $229,500 | |
| Closed | Webbert Jim E | $155,050 |
Source: Public Records
Tax History
| Year | Tax Paid | Tax Assessment Tax Assessment Total Assessment is a certain percentage of the fair market value that is determined by local assessors to be the total taxable value of land and additions on the property. | Land | Improvement |
|---|---|---|---|---|
| 2026 | $1,974 | $98,645 | $39,340 | $59,305 |
| 2024 | $2,489 | $96,924 | $35,595 | $61,329 |
| 2023 | $2,489 | $95,764 | $37,520 | $58,244 |
| 2022 | $2,416 | $80,108 | $31,605 | $48,503 |
| 2021 | $2,346 | $70,132 | $21,735 | $48,397 |
| 2020 | $2,276 | $69,507 | $20,895 | $48,612 |
| 2019 | $2,209 | $67,809 | $20,755 | $47,054 |
| 2018 | $2,145 | $61,279 | $15,085 | $46,194 |
| 2017 | $2,082 | $60,402 | $14,070 | $46,332 |
| 2016 | $2,031 | $60,118 | $12,670 | $47,448 |
| 2015 | $2,027 | $58,354 | $11,095 | $47,259 |
| 2014 | $1,968 | $55,387 | $9,975 | $45,412 |
| 2013 | -- | $52,044 | $7,245 | $44,799 |
Source: Public Records
Map
Nearby Homes
- 6566 Chesterfield Ln
- 6850 Sharlands Ave Unit 1165
- 6850 Sharlands Ave Unit U2123
- 6850 Sharlands Ave Unit f2026
- 6850 Sharlands Ave Unit L2066
- 6331 Chesterfield Ln
- 1285 Moon Ridge Cir
- 395 Jackson Springs Dr
- 325 Jackson Springs Dr
- 6290 Chesterfield Ln
- 1585 Mescalero Ave
- 0 Unit 250003854
- 6052 Bankside Way
- 265 Anselmo Dr
- 8101 Leroy St
- 5875 Walnut Creek Rd
- 5846 Walnut Creek Rd
- 7440 W 4th St
- 7440 W 4th St Unit 7
- 7440 W 4th St Unit 73
- 6592 Fall River Cir
- 6580 Fall River Cir
- 6598 Fall River Cir
- 6574 Fall River Cir
- 6575 Fall River Cir
- 6571 Fall River Cir
- 6674 Chesterfield Ln
- 6658 Chesterfield Ln
- 6686 Chesterfield Ln
- 6568 Fall River Cir
- 6565 Fall River Cir
- 6646 Chesterfield Ln
- 6698 Chesterfield Ln
- 6553 Fall River Cir
- 6632 Chesterfield Ln
- 6562 Fall River Cir
- 6710 Chesterfield Ln
- 6547 Fall River Cir
- 6628 Chesterfield Ln
- 6556 Fall River Cir
Your Personal Tour Guide
Ask me questions while you tour the home.