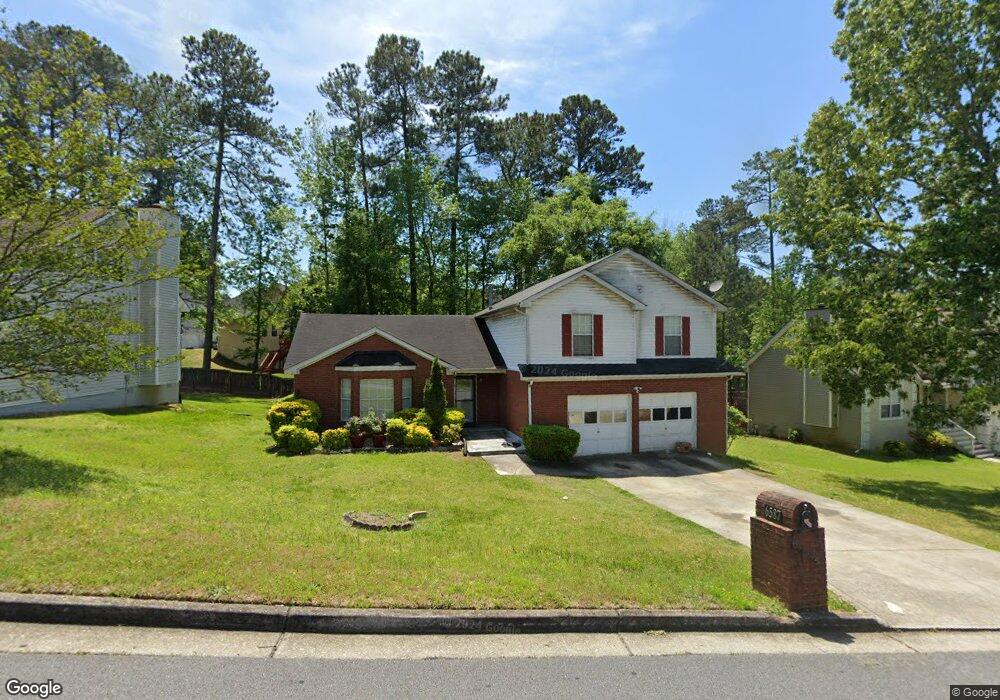
6587 Alford Way Lithonia, GA 30058
Estimated Value: $262,000 - $299,000
4
Beds
4
Baths
1,956
Sq Ft
$141/Sq Ft
Est. Value
About This Home
This home is located at 6587 Alford Way, Lithonia, GA 30058 and is currently estimated at $276,415, approximately $141 per square foot. 6587 Alford Way is a home located in DeKalb County with nearby schools including Pine Ridge Elementary School, Stephenson Middle School, and Stephenson High School.
Ownership History
Date
Name
Owned For
Owner Type
Purchase Details
Closed on
Nov 18, 2020
Sold by
Buford Sharon
Bought by
Buford Sharon and Buford Dmichael A
Current Estimated Value
Purchase Details
Closed on
Aug 25, 2017
Sold by
Pierre Dale D
Bought by
Buford Sharon
Home Financials for this Owner
Home Financials are based on the most recent Mortgage that was taken out on this home.
Original Mortgage
$135,009
Interest Rate
4.62%
Mortgage Type
FHA
Purchase Details
Closed on
Mar 28, 2000
Sold by
Johnson Oswald F and Johnson Evelyn G
Bought by
Pierre Dale D
Home Financials for this Owner
Home Financials are based on the most recent Mortgage that was taken out on this home.
Original Mortgage
$100,480
Interest Rate
8.38%
Mortgage Type
New Conventional
Purchase Details
Closed on
Nov 30, 1994
Sold by
I C I Gwinnett C
Bought by
Johnson Oswald F
Create a Home Valuation Report for This Property
The Home Valuation Report is an in-depth analysis detailing your home's value as well as a comparison with similar homes in the area
Home Values in the Area
Average Home Value in this Area
Purchase History
| Date | Buyer | Sale Price | Title Company |
|---|---|---|---|
| Buford Sharon | -- | -- | |
| Buford Sharon | $137,500 | -- | |
| Pierre Dale D | $125,600 | -- | |
| Johnson Oswald F | $101,400 | -- |
Source: Public Records
Mortgage History
| Date | Status | Borrower | Loan Amount |
|---|---|---|---|
| Previous Owner | Buford Sharon | $135,009 | |
| Previous Owner | Pierre Dale D | $100,480 | |
| Closed | Johnson Oswald F | -- |
Source: Public Records
Tax History Compared to Growth
Tax History
| Year | Tax Paid | Tax Assessment Tax Assessment Total Assessment is a certain percentage of the fair market value that is determined by local assessors to be the total taxable value of land and additions on the property. | Land | Improvement |
|---|---|---|---|---|
| 2025 | $2,843 | $102,640 | $10,000 | $92,640 |
| 2024 | $2,974 | $106,000 | $10,000 | $96,000 |
| 2023 | $2,974 | $105,320 | $10,000 | $95,320 |
| 2022 | $2,432 | $85,680 | $10,000 | $75,680 |
| 2021 | $2,050 | $69,160 | $10,000 | $59,160 |
| 2020 | $1,704 | $53,960 | $5,280 | $48,680 |
| 2019 | $1,731 | $55,720 | $5,280 | $50,440 |
| 2018 | $1,694 | $45,520 | $5,280 | $40,240 |
| 2017 | $2,267 | $43,240 | $5,280 | $37,960 |
| 2016 | $1,994 | $36,960 | $5,280 | $31,680 |
| 2014 | $1,942 | $34,920 | $5,280 | $29,640 |
Source: Public Records
Map
Nearby Homes
- 6543 Alford Way
- 6675 Princeton Park Ct
- 1276 Huntington Place Cir
- 1124 Shady Creek Dr
- 6426 Alford Cir
- 6390 Alford Cir
- 6436 Valerie Bluff
- 1001 Pine Ridge Dr
- 711 Ashley Ln
- 1213 Oak Knoll Ct
- 1246 Carriage Trace Cir
- 1086 Deshon Trail
- 812 Sweet Pine Brook
- 1286 Regal Heights Dr
- 6536 Deshon Ct
- 6643 Red Oak Way
- Hazel Plan at Summertree
- Elder Plan at Summertree
- Cedar Plan at Summertree
- Fairview Plan at Summertree
- 6593 Alford Way
- 1347 Huntington Place Cir
- 6571 Alford Way
- 1343 Huntington Place Cir
- 6590 Alford Way
- 6582 Alford Way
- 6601 Alford Way
- 1351 Huntington Place Cir
- 6576 Alford Way Unit 1
- 6596 Alford Way Unit 1
- 1341 Huntington Place Cir
- 6604 Alford Way Unit 1
- 1355 Huntington Place Cir
- 6611 Alford Way
- 1033 Alford Rd
- 1336 Huntington Place Cir
- 6610 Alford Way Unit 1
- 1352 Huntington Place Cir
- 1009 Alford Rd
- 1041 Alford Rd Unit 1