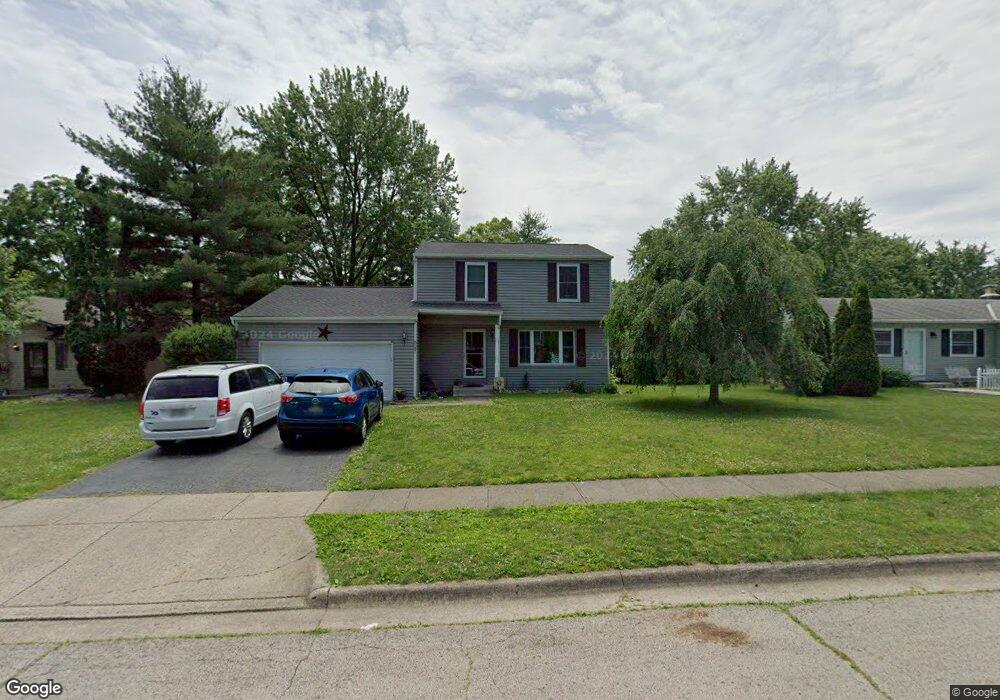
6587 Falls Cir Reynoldsburg, OH 43068
Estimated Value: $287,000 - $322,000
3
Beds
2
Baths
1,540
Sq Ft
$194/Sq Ft
Est. Value
About This Home
This home is located at 6587 Falls Cir, Reynoldsburg, OH 43068 and is currently estimated at $298,127, approximately $193 per square foot. 6587 Falls Cir is a home located in Franklin County with nearby schools including Rose Hill Elementary School, Waggoner Road Elementary School, and Waggoner Road Junior High School.
Ownership History
Date
Name
Owned For
Owner Type
Purchase Details
Closed on
Oct 11, 2011
Sold by
Federal Home Loan Mortgage Corporation
Bought by
Hagemann Brandon P and Hogemann Lindsay B
Current Estimated Value
Home Financials for this Owner
Home Financials are based on the most recent Mortgage that was taken out on this home.
Original Mortgage
$94,443
Interest Rate
4.02%
Mortgage Type
FHA
Purchase Details
Closed on
Jul 19, 2011
Sold by
Cook Connie L and Branch Banking & Trust Company
Bought by
Federal Home Loan Mortgage Corporation
Purchase Details
Closed on
Nov 15, 2000
Sold by
Cook Donald L and Cook Connie L
Bought by
Cook Donald L and Cook Connie L
Purchase Details
Closed on
Jun 17, 1996
Sold by
Est Ronald C Asel
Bought by
Cook Donald L and Cook Connie L
Home Financials for this Owner
Home Financials are based on the most recent Mortgage that was taken out on this home.
Original Mortgage
$98,262
Interest Rate
8.05%
Mortgage Type
FHA
Create a Home Valuation Report for This Property
The Home Valuation Report is an in-depth analysis detailing your home's value as well as a comparison with similar homes in the area
Home Values in the Area
Average Home Value in this Area
Purchase History
| Date | Buyer | Sale Price | Title Company |
|---|---|---|---|
| Hagemann Brandon P | $96,900 | Attorney | |
| Federal Home Loan Mortgage Corporation | $78,000 | None Available | |
| Cook Donald L | -- | Independent Title | |
| Cook Donald L | $100,650 | -- |
Source: Public Records
Mortgage History
| Date | Status | Borrower | Loan Amount |
|---|---|---|---|
| Previous Owner | Hagemann Brandon P | $94,443 | |
| Previous Owner | Cook Donald L | $98,262 |
Source: Public Records
Tax History Compared to Growth
Tax History
| Year | Tax Paid | Tax Assessment Tax Assessment Total Assessment is a certain percentage of the fair market value that is determined by local assessors to be the total taxable value of land and additions on the property. | Land | Improvement |
|---|---|---|---|---|
| 2024 | $4,550 | $88,870 | $24,680 | $64,190 |
| 2023 | $4,342 | $88,870 | $24,680 | $64,190 |
| 2022 | $3,703 | $57,330 | $12,460 | $44,870 |
| 2021 | $3,717 | $57,330 | $12,460 | $44,870 |
| 2020 | $3,793 | $57,330 | $12,460 | $44,870 |
| 2019 | $3,459 | $47,400 | $10,400 | $37,000 |
| 2018 | $3,197 | $47,400 | $10,400 | $37,000 |
| 2017 | $3,459 | $47,400 | $10,400 | $37,000 |
| 2016 | $3,029 | $37,110 | $8,930 | $28,180 |
| 2015 | $2,935 | $37,110 | $8,930 | $28,180 |
| 2014 | $2,948 | $37,110 | $8,930 | $28,180 |
| 2013 | $1,434 | $37,100 | $8,925 | $28,175 |
Source: Public Records
Map
Nearby Homes
- 6563 Helm Ave
- 622 Brice Rd
- 6564 Red Fox Rd
- 6609 Fusilier Ave
- 6700 Helm Ln
- 6737 Rocky Den Rd
- 6526 Borr Ave
- 6442 Borr Ave
- 6279 Braiden Ct Unit 10B
- 6377 Hilltop Ave
- 6810 Prior Place
- 452 Plankton Place
- 6258 Peach Tree Rd
- 419 Knob Ave
- 6231 Peach Tree Rd
- 6849 Roundelay Rd N
- 557 Woodingham Place Unit 1A
- 0 Rosehill Rd
- 6207 Roxburgh Ct Unit 16D
- 6890 Nocturne Rd N
- 6577 Falls Cir
- 6597 Falls Cir
- 6582 Helm Ave
- 6572 Helm Ave
- 6592 Helm Ave
- 6555 Falls Cir
- 717 Hunt Valley Dr
- 6588 Falls Cir
- 6598 Falls Cir
- 6564 Helm Ave
- 6600 Helm Ave
- 691 Hunt Valley Dr
- 674 Falls Place
- 681 Falls Place
- 6573 Helm Ave
- 6585 Helm Ave
- 6550 Falls Cir
- 6542 Helm Ave
- 6554 Falls Cir
- 6595 Helm Ave