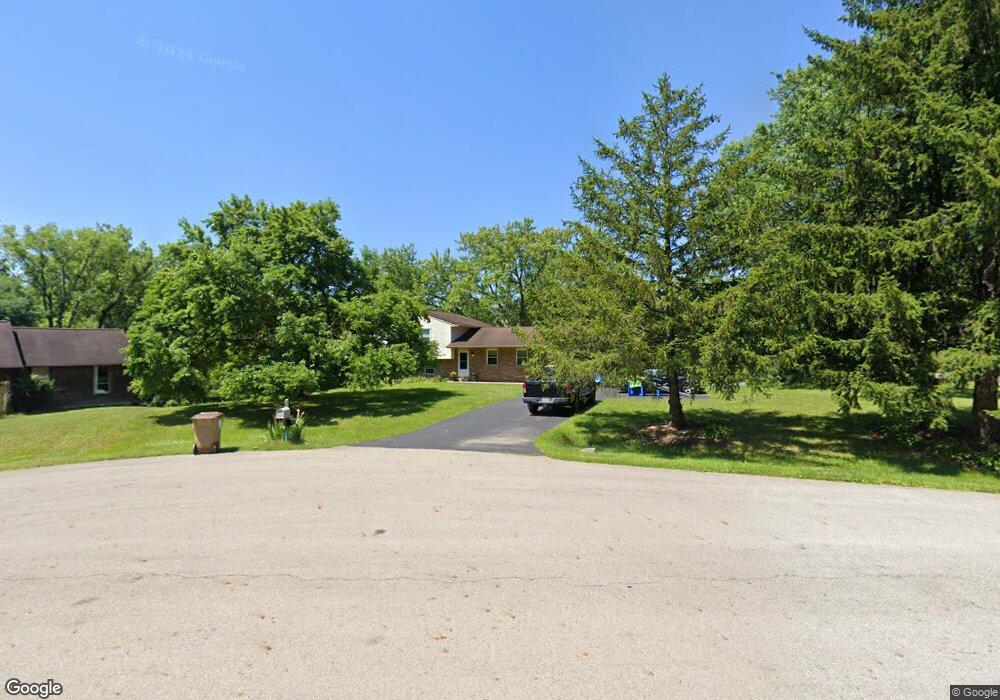
6589 Riva Ct Pickerington, OH 43147
Estimated Value: $383,000 - $395,256
4
Beds
2
Baths
1,898
Sq Ft
$206/Sq Ft
Est. Value
About This Home
This home is located at 6589 Riva Ct, Pickerington, OH 43147 and is currently estimated at $390,314, approximately $205 per square foot. 6589 Riva Ct is a home located in Fairfield County with nearby schools including Toll Gate Elementary School, Toll Gate Middle School, and Pickerington Lakeview Junior High School.
Ownership History
Date
Name
Owned For
Owner Type
Purchase Details
Closed on
Aug 12, 2020
Sold by
Rockey Joshua F S and Rockey Erin C
Bought by
Tensen Adam B and Tensen Melinda K
Current Estimated Value
Home Financials for this Owner
Home Financials are based on the most recent Mortgage that was taken out on this home.
Original Mortgage
$211,200
Outstanding Balance
$187,349
Interest Rate
3%
Mortgage Type
New Conventional
Estimated Equity
$202,965
Purchase Details
Closed on
Jul 17, 2009
Sold by
Welker Helmut P and Welker Carol A
Bought by
Rockey Joshua F S and Rockey Erin C
Home Financials for this Owner
Home Financials are based on the most recent Mortgage that was taken out on this home.
Original Mortgage
$159,065
Interest Rate
5.62%
Mortgage Type
FHA
Purchase Details
Closed on
Jul 28, 2003
Sold by
Welker Helmut P and Welker Carol A
Bought by
Welker Helmut P and Welker Carol A
Create a Home Valuation Report for This Property
The Home Valuation Report is an in-depth analysis detailing your home's value as well as a comparison with similar homes in the area
Home Values in the Area
Average Home Value in this Area
Purchase History
| Date | Buyer | Sale Price | Title Company |
|---|---|---|---|
| Tensen Adam B | $264,000 | First Ohio Title Insurance | |
| Rockey Joshua F S | $162,000 | Attorney | |
| Welker Helmut P | -- | -- |
Source: Public Records
Mortgage History
| Date | Status | Borrower | Loan Amount |
|---|---|---|---|
| Open | Tensen Adam B | $211,200 | |
| Closed | Rockey Joshua F S | $159,065 |
Source: Public Records
Tax History Compared to Growth
Tax History
| Year | Tax Paid | Tax Assessment Tax Assessment Total Assessment is a certain percentage of the fair market value that is determined by local assessors to be the total taxable value of land and additions on the property. | Land | Improvement |
|---|---|---|---|---|
| 2024 | $10,166 | $85,790 | $20,560 | $65,230 |
| 2023 | $3,903 | $85,790 | $20,560 | $65,230 |
| 2022 | $3,915 | $85,790 | $20,560 | $65,230 |
| 2021 | $3,515 | $65,610 | $17,290 | $48,320 |
| 2020 | $3,553 | $65,610 | $17,290 | $48,320 |
| 2019 | $3,576 | $65,610 | $17,290 | $48,320 |
| 2018 | $3,253 | $46,250 | $17,290 | $28,960 |
| 2017 | $3,257 | $52,130 | $17,380 | $34,750 |
| 2016 | $3,239 | $52,130 | $17,380 | $34,750 |
| 2015 | $2,949 | $45,990 | $15,800 | $30,190 |
| 2014 | $2,911 | $45,990 | $15,800 | $30,190 |
| 2013 | $2,911 | $45,990 | $15,800 | $30,190 |
Source: Public Records
Map
Nearby Homes
- 11779 Covington Ct NW
- 11774 Kennington Square E
- 11555 Forest Lane Ave
- 11885 Kennington Square E
- 11867 Kennington Square W
- 11388 Huntington Way NW
- 11179 Keswick Dr NW
- 11099 Keswick Dr NW
- 12146 Prairie View NW
- 7031 Sanctuary NW
- 12234 Tybee NW
- 12157 Tybee NW
- 12186 Tybee NW
- 12235 Tybee Ct NW
- 12150 Tybee Ct NW
- 7044 Sanctuary Dr NW
- Worthington Plan at Heron Crossing
- Fremont Plan at Heron Crossing
- Dearborn Plan at Heron Crossing
- Madison Plan at Heron Crossing
- 6589 Riva Ct NW
- 6603 Chadwick Ct
- 6587 Riva Ct
- 6605 Chadwick Ct
- 6585 Riva Ct
- 6592 Kennington Square S
- 6582 Kennington Square S
- 6571 Kennington Square S
- 6583 Riva Ct
- 6602 Kennington Square S
- 6607 Chadwick Ct NW
- 6607 Chadwick Ct
- 6612 Kennington Square S
- 6561 Kennington Square S
- 6611 Kennington Square S
- 6556 Riverton Cir
- 6558 Riverton Cir
- 6556 Riverton Cir NW
- 6554 Riverton Cir
- 11550 Windridge Dr