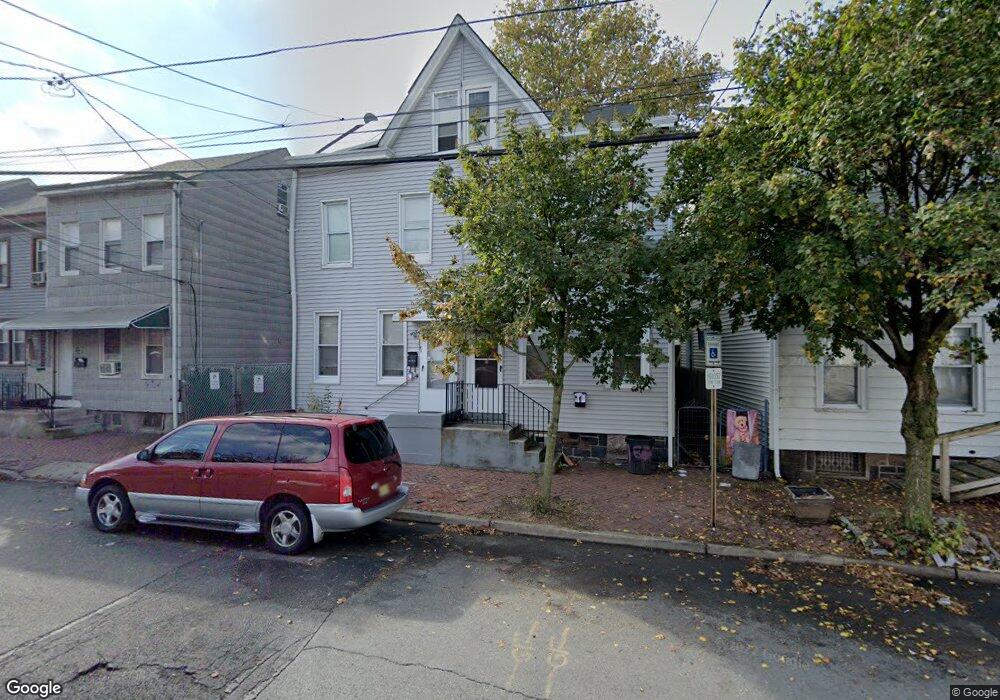
659 2nd St Trenton, NJ 08611
South Trenton NeighborhoodEstimated Value: $134,000 - $193,000
--
Bed
--
Bath
1,236
Sq Ft
$135/Sq Ft
Est. Value
About This Home
This home is located at 659 2nd St, Trenton, NJ 08611 and is currently estimated at $166,340, approximately $134 per square foot. 659 2nd St is a home located in Mercer County with nearby schools including Mott Elementary School, Parker Elementary School, and Grace A Dunn Middle School.
Ownership History
Date
Name
Owned For
Owner Type
Purchase Details
Closed on
Jan 28, 2025
Sold by
Onik Alex and Paley Vadim
Bought by
Bbsms Realty 2 Llc
Current Estimated Value
Home Financials for this Owner
Home Financials are based on the most recent Mortgage that was taken out on this home.
Original Mortgage
$139,500
Outstanding Balance
$138,661
Interest Rate
6.85%
Mortgage Type
New Conventional
Estimated Equity
$27,679
Purchase Details
Closed on
Mar 6, 2014
Sold by
Dandrea Kimberlee A and Dandrea Kenneth M
Bought by
Paley Vadim and Onik Alex
Purchase Details
Closed on
Aug 26, 2010
Sold by
Estate Of Kristine K Szul and Dandrea Kimberlee A
Bought by
Dandrea Kimberlee A and Dandrea Kenneth M
Create a Home Valuation Report for This Property
The Home Valuation Report is an in-depth analysis detailing your home's value as well as a comparison with similar homes in the area
Home Values in the Area
Average Home Value in this Area
Purchase History
| Date | Buyer | Sale Price | Title Company |
|---|---|---|---|
| Bbsms Realty 2 Llc | $150,000 | Brennan Title Abstract | |
| Bbsms Realty 2 Llc | $150,000 | Brennan Title Abstract | |
| Paley Vadim | $10,000 | None Available | |
| Dandrea Kimberlee A | -- | None Available |
Source: Public Records
Mortgage History
| Date | Status | Borrower | Loan Amount |
|---|---|---|---|
| Open | Bbsms Realty 2 Llc | $139,500 | |
| Closed | Bbsms Realty 2 Llc | $139,500 |
Source: Public Records
Tax History Compared to Growth
Tax History
| Year | Tax Paid | Tax Assessment Tax Assessment Total Assessment is a certain percentage of the fair market value that is determined by local assessors to be the total taxable value of land and additions on the property. | Land | Improvement |
|---|---|---|---|---|
| 2025 | $2,924 | $50,400 | $7,800 | $42,600 |
| 2024 | $2,806 | $50,400 | $7,800 | $42,600 |
| 2023 | $2,806 | $50,400 | $7,800 | $42,600 |
| 2022 | $2,751 | $50,400 | $7,800 | $42,600 |
| 2021 | $2,799 | $50,400 | $7,800 | $42,600 |
| 2020 | $2,790 | $50,400 | $7,800 | $42,600 |
| 2019 | $2,745 | $50,400 | $7,800 | $42,600 |
| 2018 | $2,627 | $50,400 | $7,800 | $42,600 |
| 2017 | $2,497 | $50,400 | $7,800 | $42,600 |
| 2016 | $2,859 | $49,700 | $13,100 | $36,600 |
| 2015 | $2,849 | $49,700 | $13,100 | $36,600 |
| 2014 | $2,836 | $49,700 | $13,100 | $36,600 |
Source: Public Records
Map
Nearby Homes