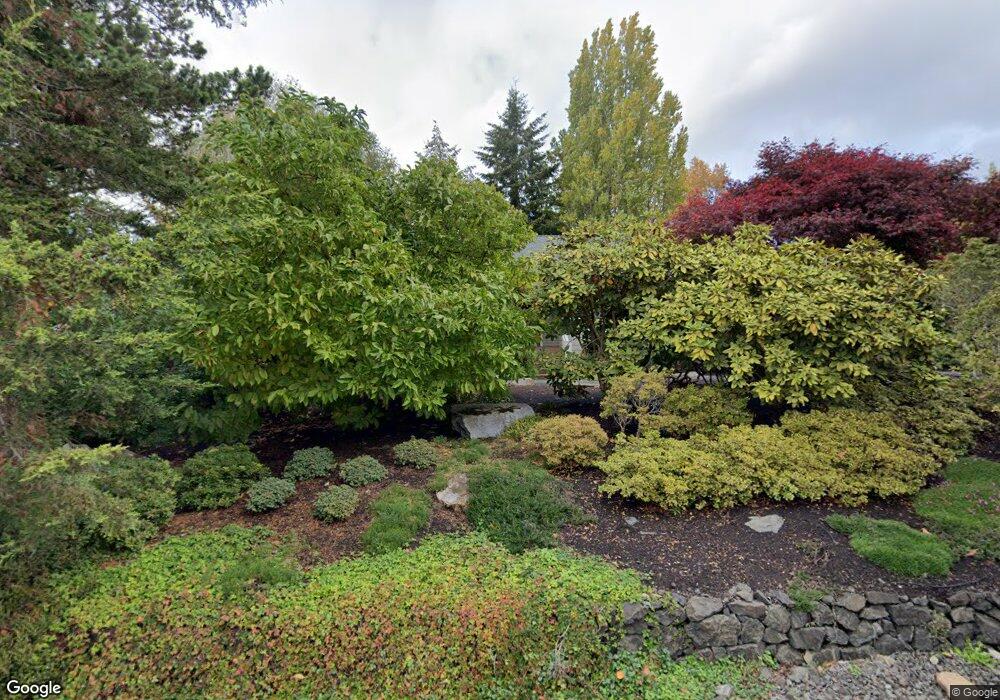
659 Al Dorsey Ln NW Bainbridge Island, WA 98110
Estimated Value: $1,293,000 - $1,528,000
3
Beds
4
Baths
2,223
Sq Ft
$619/Sq Ft
Est. Value
About This Home
This home is located at 659 Al Dorsey Ln NW, Bainbridge Island, WA 98110 and is currently estimated at $1,375,306, approximately $618 per square foot. 659 Al Dorsey Ln NW is a home located in Kitsap County with nearby schools including Bainbridge High School, Madrona School, and St. Cecilia Catholic School.
Ownership History
Date
Name
Owned For
Owner Type
Purchase Details
Closed on
Apr 15, 2025
Sold by
659Ad Llc
Bought by
Doran Elizabeth
Current Estimated Value
Purchase Details
Closed on
Aug 5, 2024
Sold by
Doran Elizabeth
Bought by
659Ad Llc
Purchase Details
Closed on
Nov 29, 2022
Sold by
Doran Elizabeth and Erving Elizabeth D
Bought by
Doran Elizabeth and Erving Elizabeth D
Purchase Details
Closed on
Oct 27, 2011
Sold by
Erving Robert Macdonald
Bought by
Erving Elizabeth D
Purchase Details
Closed on
Mar 14, 2003
Sold by
Worrell Jack A
Bought by
Erving Robert Mcdonald and Erving Elizabeth D
Purchase Details
Closed on
Apr 10, 2001
Sold by
Worrell Jack A
Bought by
Worrell Jack A
Purchase Details
Closed on
May 21, 1997
Sold by
Spellman Construction Inc
Bought by
Worrell Jack A and Worrell Alice
Purchase Details
Closed on
Mar 12, 1997
Sold by
Dorsey James M and Dorsey Faye M
Bought by
Spellman Construction Inc
Create a Home Valuation Report for This Property
The Home Valuation Report is an in-depth analysis detailing your home's value as well as a comparison with similar homes in the area
Home Values in the Area
Average Home Value in this Area
Purchase History
| Date | Buyer | Sale Price | Title Company |
|---|---|---|---|
| Doran Elizabeth | $313 | None Listed On Document | |
| 659Ad Llc | $313 | None Listed On Document | |
| Doran Elizabeth | -- | None Listed On Document | |
| Erving Elizabeth D | -- | None Available | |
| Erving Robert Mcdonald | $375,000 | Pacific Nw Title | |
| Worrell Jack A | -- | -- | |
| Worrell Jack A | $80,000 | Pacific Nw Title | |
| Spellman Construction Inc | $40,600 | Pacific Nw Title |
Source: Public Records
Tax History Compared to Growth
Tax History
| Year | Tax Paid | Tax Assessment Tax Assessment Total Assessment is a certain percentage of the fair market value that is determined by local assessors to be the total taxable value of land and additions on the property. | Land | Improvement |
|---|---|---|---|---|
| 2026 | $10,168 | $1,259,670 | $321,440 | $938,230 |
| 2025 | $10,168 | $1,259,670 | $321,440 | $938,230 |
| 2024 | $9,717 | $1,259,670 | $321,440 | $938,230 |
| 2023 | $10,142 | $1,259,670 | $321,440 | $938,230 |
| 2022 | $10,032 | $1,062,580 | $242,110 | $820,470 |
| 2021 | $9,858 | $995,720 | $226,690 | $769,030 |
| 2020 | $9,467 | $942,230 | $214,350 | $727,880 |
| 2019 | $8,697 | $882,050 | $200,470 | $681,580 |
| 2018 | $8,634 | $681,470 | $154,210 | $527,260 |
| 2017 | $7,098 | $681,470 | $154,210 | $527,260 |
| 2016 | $6,575 | $598,930 | $154,210 | $444,720 |
| 2015 | $5,644 | $522,990 | $134,710 | $388,280 |
| 2014 | -- | $473,900 | $134,710 | $339,190 |
| 2013 | -- | $442,960 | $125,850 | $317,110 |
Source: Public Records
Map
Nearby Homes
- 737 Village Cir NW
- 228 Canopy Path NW
- 224 Canopy Path NW
- 208 Shepard Way NW
- 204 Shepard Way NW
- 3 Bedroom Plan at Trillium, Grow Community | Bainbridge Island - The Trillium
- 2 Bedroom Plan at Trillium, Grow Community | Bainbridge Island - The Trillium
- 1116 Grow Ave NW
- 115 Hall Brothers Loop NW Unit 203
- 962 Dove Tail Ln NW Unit 3
- 8784 NE Winslow Grove Ct
- 213 Eakin Dr NW
- 1250 Weaver Rd NW Unit A8
- 346 Wyatt Way NE Unit 10
- 360 Knechtel Way NE Unit 201
- 511 Groos Ln NE
- 8277 New Holland Ct NE
- 752 NE Vineyard Ln Unit L205
- 610 NE Vineyard Ln Unit A104
- 141 Parfitt Way SW Unit M-10
- 657 Al Dorsey Ln NW
- 661 Al Dorsey Ln NW
- 564 Pierce Ct NW
- 639 Annie Rose Ln NW
- 580 Pierce Ct NW
- 655 Al Dorsey Ln NW
- 633 Annie Rose Ln NW
- 641 Annie Rose Ln NW
- 502 Pierce Ct NW
- 636 Pierce Ct NW
- 637 Lovell Ave NW
- 643 Annie Rose Ln NW
- 652 Pierce Ct NW
- 653 Al Dorsey Ln NW
- 598 Lovell Ave NW
- 634 Lovell Ave NW
- 676 Lovell Ave NW
- 565 Pierce Ct NW
- 543 Pierce Ct NW
- 589 Pierce Ct NW