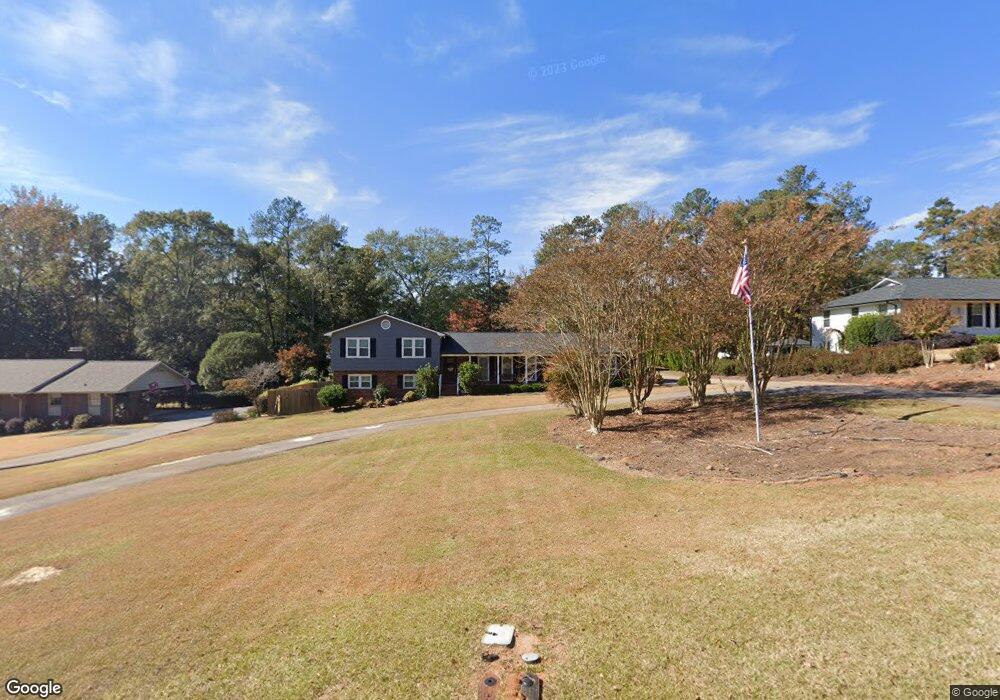
659 Azalea Dr Lagrange, GA 30240
Estimated Value: $444,672 - $509,000
5
Beds
5
Baths
4,192
Sq Ft
$112/Sq Ft
Est. Value
About This Home
This home is located at 659 Azalea Dr, Lagrange, GA 30240 and is currently estimated at $469,668, approximately $112 per square foot. 659 Azalea Dr is a home located in Troup County with nearby schools including Hollis Hand Elementary School, Franklin Forest Elementary School, and Ethel W. Kight Elementary School.
Ownership History
Date
Name
Owned For
Owner Type
Purchase Details
Closed on
May 4, 2018
Sold by
Naik Hema
Bought by
Farrell Riley Jarrett and Farrell Kelli Richard
Current Estimated Value
Home Financials for this Owner
Home Financials are based on the most recent Mortgage that was taken out on this home.
Original Mortgage
$184,000
Outstanding Balance
$158,090
Interest Rate
4.4%
Mortgage Type
New Conventional
Estimated Equity
$311,578
Purchase Details
Closed on
Jun 4, 1990
Sold by
Naik Madhav V
Bought by
Naik Hema
Purchase Details
Closed on
Mar 19, 1973
Sold by
Johnson Lawrence L and Johnson Laurel M
Bought by
Naik Madhav V
Purchase Details
Closed on
Mar 1, 1971
Sold by
Gallman Robert D
Bought by
Johnson Lawrence L and Johnson Laurel M
Purchase Details
Closed on
Apr 1, 1967
Sold by
Piney Woods Company
Bought by
Gallman Robert D
Create a Home Valuation Report for This Property
The Home Valuation Report is an in-depth analysis detailing your home's value as well as a comparison with similar homes in the area
Purchase History
| Date | Buyer | Sale Price | Title Company |
|---|---|---|---|
| Farrell Riley Jarrett | $230,000 | -- | |
| Naik Hema | -- | -- | |
| Naik Madhav V | $49,300 | -- | |
| Johnson Lawrence L | $12,400 | -- | |
| Gallman Robert D | $4,400 | -- |
Source: Public Records
Mortgage History
| Date | Status | Borrower | Loan Amount |
|---|---|---|---|
| Open | Farrell Riley Jarrett | $184,000 |
Source: Public Records
Tax History
| Year | Tax Paid | Tax Assessment Tax Assessment Total Assessment is a certain percentage of the fair market value that is determined by local assessors to be the total taxable value of land and additions on the property. | Land | Improvement |
|---|---|---|---|---|
| 2025 | $4,518 | $184,276 | $18,000 | $166,276 |
| 2024 | $3,696 | $137,520 | $11,160 | $126,360 |
| 2023 | $3,387 | $126,172 | $11,160 | $115,012 |
| 2022 | $3,221 | $117,412 | $11,160 | $106,252 |
| 2021 | $2,752 | $93,244 | $11,160 | $82,084 |
| 2020 | $2,812 | $93,244 | $11,160 | $82,084 |
| 2019 | $2,721 | $90,216 | $11,160 | $79,056 |
| 2018 | $2,607 | $86,452 | $11,160 | $75,292 |
| 2017 | $2,493 | $82,644 | $9,112 | $73,532 |
| 2016 | $2,170 | $71,956 | $9,112 | $62,844 |
| 2015 | $2,226 | $73,688 | $10,844 | $62,844 |
| 2014 | $2,191 | $72,392 | $10,844 | $61,548 |
| 2013 | -- | $77,043 | $10,844 | $66,199 |
Source: Public Records
Map
Nearby Homes
- 222 Beechwood Cir
- 109 Thomas St
- 705 Piney Woods Dr
- 219 Banks St
- 105 Saynor Cir
- 724 Camellia Dr
- 106 Ewing St
- 420 Ridgecrest Rd
- 900 North St
- 216 E Lane Cir
- 732 Camellia Dr
- 0 Ridley Ave Unit 10550104
- 609 Ridley Ave
- 707 Ridley Ave
- 611 Ridley Ave
- 615 Ridley Ave
- 709 Ridley Ave
- 110 Russell St
- 203 Waverly Way
- 204 Colonial St
- 653 Azalea Dr
- 665 Azalea Dr
- 664 Lakewood Dr
- 649 Azalea Dr
- 670 Lakewood Dr
- 670 Lakewood Dr Unit 62
- 658 Lakewood Dr
- 701 Azalea Dr
- 652 Azalea Dr
- 650 Azalea Dr
- 662 Azalea Dr
- 644 Granger Dr
- 668 Azalea Dr
- 650 Lakewood Dr
- 645 Azalea Dr
- 704 Lakewood Dr
- 647 Granger Dr
- 641 Granger Dr
- 705 Azalea Dr
- 404 Granger Dr
Your Personal Tour Guide
Ask me questions while you tour the home.