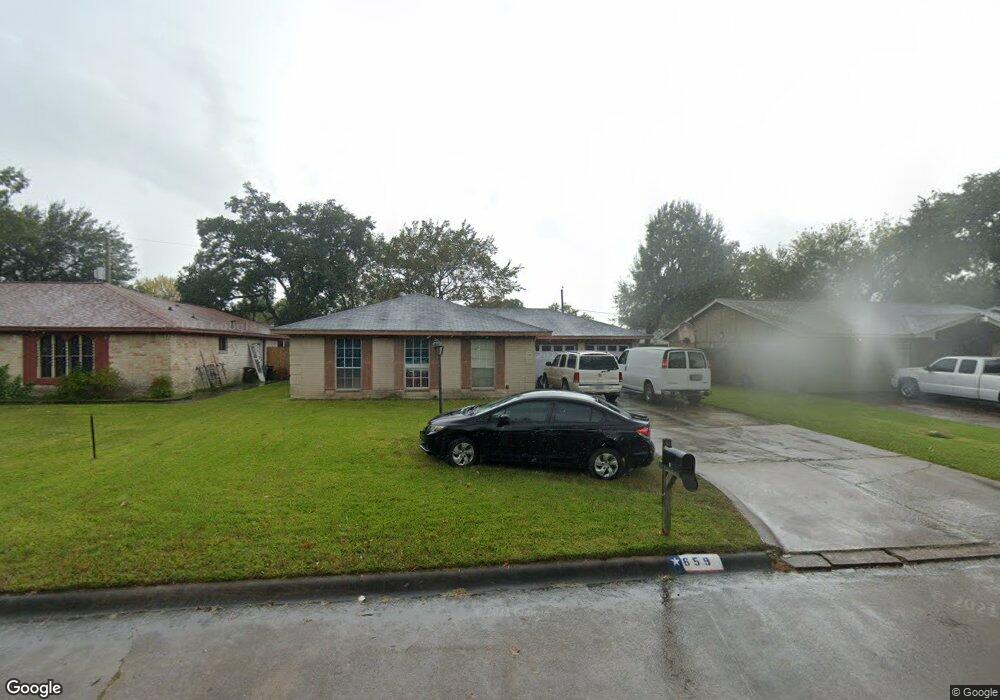
659 Blanding Dr Houston, TX 77015
Estimated Value: $217,000 - $298,000
3
Beds
2
Baths
1,977
Sq Ft
$135/Sq Ft
Est. Value
About This Home
This home is located at 659 Blanding Dr, Houston, TX 77015 and is currently estimated at $266,333, approximately $134 per square foot. 659 Blanding Dr is a home located in Harris County with nearby schools including Sam Houston Elementary School, Cobb 6th Grade Campus, and North Shore Middle School.
Ownership History
Date
Name
Owned For
Owner Type
Purchase Details
Closed on
Feb 1, 2005
Sold by
Roegner Stefani Denise
Bought by
Rivera Rodrigo
Current Estimated Value
Home Financials for this Owner
Home Financials are based on the most recent Mortgage that was taken out on this home.
Original Mortgage
$90,250
Outstanding Balance
$46,023
Interest Rate
5.8%
Mortgage Type
Purchase Money Mortgage
Estimated Equity
$220,310
Purchase Details
Closed on
Feb 5, 1999
Sold by
Buckner Curtis L and Buckner Phyllis
Bought by
Roegner Clayton R and Roegner Stefani
Home Financials for this Owner
Home Financials are based on the most recent Mortgage that was taken out on this home.
Original Mortgage
$72,863
Interest Rate
6.79%
Mortgage Type
FHA
Create a Home Valuation Report for This Property
The Home Valuation Report is an in-depth analysis detailing your home's value as well as a comparison with similar homes in the area
Home Values in the Area
Average Home Value in this Area
Purchase History
| Date | Buyer | Sale Price | Title Company |
|---|---|---|---|
| Rivera Rodrigo | -- | First American Title | |
| Roegner Clayton R | -- | Texas American Title Company |
Source: Public Records
Mortgage History
| Date | Status | Borrower | Loan Amount |
|---|---|---|---|
| Open | Rivera Rodrigo | $90,250 | |
| Previous Owner | Roegner Clayton R | $72,863 |
Source: Public Records
Tax History Compared to Growth
Tax History
| Year | Tax Paid | Tax Assessment Tax Assessment Total Assessment is a certain percentage of the fair market value that is determined by local assessors to be the total taxable value of land and additions on the property. | Land | Improvement |
|---|---|---|---|---|
| 2025 | $3,557 | $288,246 | $39,427 | $248,819 |
| 2024 | $3,557 | $344,497 | $39,427 | $305,070 |
| 2023 | $3,557 | $324,720 | $39,427 | $285,293 |
| 2022 | $6,869 | $274,517 | $32,258 | $242,259 |
| 2021 | $6,740 | $265,697 | $32,258 | $233,439 |
| 2020 | $6,411 | $201,901 | $32,258 | $169,643 |
| 2019 | $4,140 | $135,971 | $32,258 | $103,713 |
| 2018 | $1,005 | $111,094 | $25,090 | $86,004 |
| 2017 | $3,574 | $111,094 | $25,090 | $86,004 |
| 2016 | $3,249 | $98,188 | $21,506 | $76,682 |
| 2015 | $1,312 | $96,395 | $13,262 | $83,133 |
| 2014 | $1,312 | $79,191 | $13,262 | $65,929 |
Source: Public Records
Map
Nearby Homes
- 14735 Lerner Dr
- 634 Bright Penny Ln
- 623 Rockbrook Dr
- 726 Brookview St
- 14923 Lofton St
- 639 Manor St
- 14914 Lawther St
- 919 Moorside Ln
- 707 Doncrest St
- 827 Dondell St
- 727 Doncrest St
- 14613 Hillsboro St
- 919 Earlsferry Dr
- 730 Doncrest St
- 719 Manor St
- 14538 Eagle Pass St
- 14512 Texarkana St
- 15122 Sheffield Terrace
- 14506 Corpus Christi St Unit 4
- 14504 Corpus Christi St Unit 4
- 663 Blanding Dr
- 655 Blanding Dr
- 654 Rockbrook Dr
- 650 Rockbrook Dr
- 651 Blanding Dr
- 667 Blanding Dr
- 658 Rockbrook Dr
- 662 Rockbrook Dr
- 662 Blanding Dr
- 646 Rockbrook Dr
- 654 Blanding Dr
- 647 Blanding Dr
- 695 Blanding Dr
- 694 Rockbrook Dr
- 642 Rockbrook Dr
- 14726 Lerner Dr
- 14727 Boylston Dr
- 646 Blanding Dr
- 650 Blanding Dr
- 643 Blanding Dr