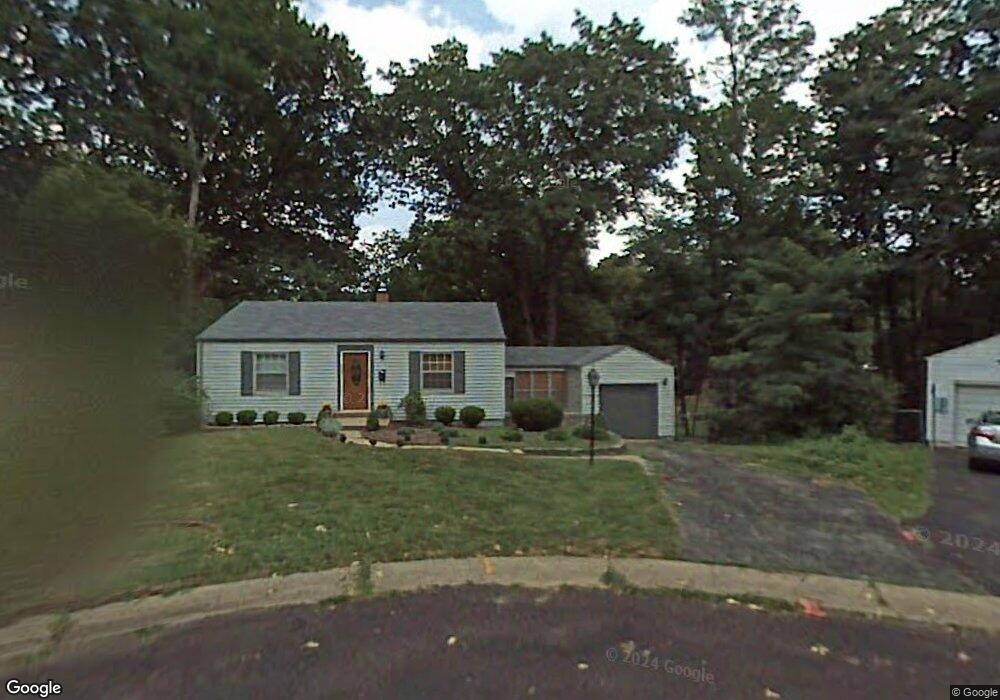
659 Chelsea Ct Saint Louis, MO 63122
Estimated Value: $317,000 - $356,000
2
Beds
2
Baths
970
Sq Ft
$343/Sq Ft
Est. Value
About This Home
This home is located at 659 Chelsea Ct, Saint Louis, MO 63122 and is currently estimated at $332,660, approximately $342 per square foot. 659 Chelsea Ct is a home located in St. Louis County with nearby schools including North Glendale Elementary School, Nipher Middle School, and Kirkwood Senior High School.
Ownership History
Date
Name
Owned For
Owner Type
Purchase Details
Closed on
Jul 21, 2009
Sold by
Sansone Anthony F
Bought by
Afs Family Limited Partnership
Current Estimated Value
Purchase Details
Closed on
Jul 29, 2004
Sold by
Koch Matthew and Howe Koch Tracey L
Bought by
Sansone Anthony F
Home Financials for this Owner
Home Financials are based on the most recent Mortgage that was taken out on this home.
Original Mortgage
$165,000
Interest Rate
6.26%
Mortgage Type
Purchase Money Mortgage
Purchase Details
Closed on
Mar 31, 2000
Sold by
Brennan and Patricia
Bought by
Koch Matthew and Howe Koch Tracey L
Home Financials for this Owner
Home Financials are based on the most recent Mortgage that was taken out on this home.
Original Mortgage
$100,800
Interest Rate
8.33%
Create a Home Valuation Report for This Property
The Home Valuation Report is an in-depth analysis detailing your home's value as well as a comparison with similar homes in the area
Home Values in the Area
Average Home Value in this Area
Purchase History
| Date | Buyer | Sale Price | Title Company |
|---|---|---|---|
| Afs Family Limited Partnership | -- | None Available | |
| Sansone Anthony F | $165,000 | -- | |
| Koch Matthew | $112,000 | -- |
Source: Public Records
Mortgage History
| Date | Status | Borrower | Loan Amount |
|---|---|---|---|
| Previous Owner | Sansone Anthony F | $165,000 | |
| Previous Owner | Koch Matthew | $100,800 |
Source: Public Records
Tax History Compared to Growth
Tax History
| Year | Tax Paid | Tax Assessment Tax Assessment Total Assessment is a certain percentage of the fair market value that is determined by local assessors to be the total taxable value of land and additions on the property. | Land | Improvement |
|---|---|---|---|---|
| 2025 | $3,012 | $56,070 | $47,920 | $8,150 |
| 2024 | $3,012 | $47,790 | $39,920 | $7,870 |
| 2023 | $2,965 | $47,790 | $39,920 | $7,870 |
| 2022 | $2,794 | $41,990 | $37,830 | $4,160 |
| 2021 | $2,758 | $41,990 | $37,830 | $4,160 |
| 2020 | $2,905 | $42,560 | $37,830 | $4,730 |
| 2019 | $2,905 | $42,560 | $37,830 | $4,730 |
| 2018 | $2,924 | $37,830 | $28,750 | $9,080 |
| 2017 | $2,920 | $37,830 | $28,750 | $9,080 |
| 2016 | $2,517 | $32,810 | $22,360 | $10,450 |
| 2015 | $2,514 | $32,810 | $22,360 | $10,450 |
| 2014 | $2,372 | $30,260 | $11,340 | $18,920 |
Source: Public Records
Map
Nearby Homes
- 754 Brownell Ave
- 826 Chelsea Ave
- 830 Victoria Place
- 641 Brookhaven Ct
- 858 Chelsea Ave
- 551 Brookhaven Ct
- 931 Brownell Ave
- 1095 N Sappington Rd
- 832 Fuhrmann Terrace
- 1 Dickson Ct
- 438 N Sappington Rd Unit B
- 436 N Sappington Rd Unit C
- 807 E Essex Ave
- 1306 Glendale Gardens Dr Unit B
- 1306 Glendale Gardens Dr Unit C
- 946 Dwyer Ave
- 1025 Glenmoor Ln
- 987 Dwyer Ave
- 423 Parkland Ave
- 1030 Sylvan Place