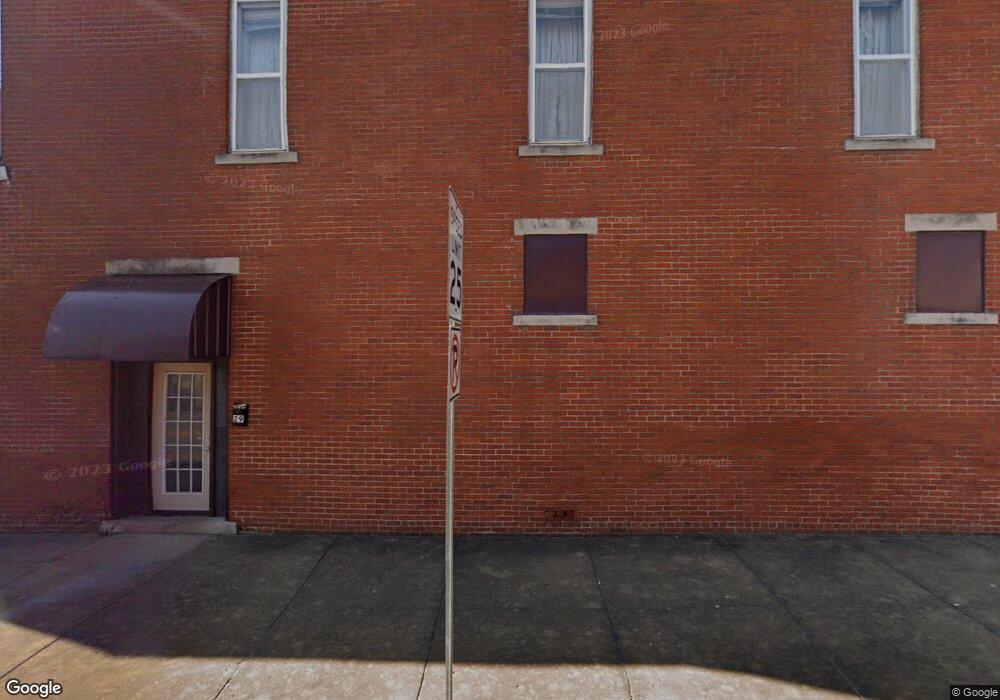
659 E St NW Linton, IN 47441
Estimated Value: $106,000 - $132,000
2
Beds
1
Bath
1,244
Sq Ft
$99/Sq Ft
Est. Value
About This Home
This home is located at 659 E St NW, Linton, IN 47441 and is currently estimated at $123,731, approximately $99 per square foot. 659 E St NW is a home located in Greene County with nearby schools including Linton-Stockton Elementary School, Linton-Stockton Junior High School, and Linton-Stockton High School.
Ownership History
Date
Name
Owned For
Owner Type
Purchase Details
Closed on
Apr 5, 2023
Sold by
Crossroad Enterprises Llc
Bought by
Griffith Janelle
Current Estimated Value
Home Financials for this Owner
Home Financials are based on the most recent Mortgage that was taken out on this home.
Original Mortgage
$92,929
Outstanding Balance
$89,802
Interest Rate
6.5%
Mortgage Type
New Conventional
Estimated Equity
$33,929
Purchase Details
Closed on
Sep 1, 2017
Sold by
Gibson Angela Marie
Bought by
Crossroad Enterprises Llc
Home Financials for this Owner
Home Financials are based on the most recent Mortgage that was taken out on this home.
Original Mortgage
$69,000
Interest Rate
4.6%
Mortgage Type
New Conventional
Purchase Details
Closed on
Oct 7, 2004
Sold by
Lehman Nigel W and Lehman Barbara
Bought by
Gibson Angela Marie
Create a Home Valuation Report for This Property
The Home Valuation Report is an in-depth analysis detailing your home's value as well as a comparison with similar homes in the area
Home Values in the Area
Average Home Value in this Area
Purchase History
| Date | Buyer | Sale Price | Title Company |
|---|---|---|---|
| Griffith Janelle | -- | None Listed On Document | |
| Crossroad Enterprises Llc | -- | None Available | |
| Gibson Angela Marie | $20,000 | -- |
Source: Public Records
Mortgage History
| Date | Status | Borrower | Loan Amount |
|---|---|---|---|
| Open | Griffith Janelle | $92,929 | |
| Previous Owner | Crossroad Enterprises Llc | $69,000 |
Source: Public Records
Tax History
| Year | Tax Paid | Tax Assessment Tax Assessment Total Assessment is a certain percentage of the fair market value that is determined by local assessors to be the total taxable value of land and additions on the property. | Land | Improvement |
|---|---|---|---|---|
| 2025 | $336 | $39,900 | $6,900 | $33,000 |
| 2024 | $336 | $32,400 | $6,900 | $25,500 |
| 2023 | $323 | $32,100 | $6,900 | $25,200 |
| 2022 | $658 | $32,900 | $6,900 | $26,000 |
| 2021 | $626 | $30,700 | $6,900 | $23,800 |
| 2020 | $604 | $29,600 | $6,900 | $22,700 |
| 2019 | $604 | $29,600 | $6,900 | $22,700 |
| 2018 | $632 | $31,000 | $6,900 | $24,100 |
| 2017 | $682 | $45,600 | $6,900 | $38,700 |
| 2016 | $924 | $45,100 | $6,900 | $38,200 |
| 2014 | $268 | $41,100 | $6,900 | $34,200 |
| 2013 | -- | $40,700 | $6,900 | $33,800 |
Source: Public Records
Map
Nearby Homes
Your Personal Tour Guide
Ask me questions while you tour the home.