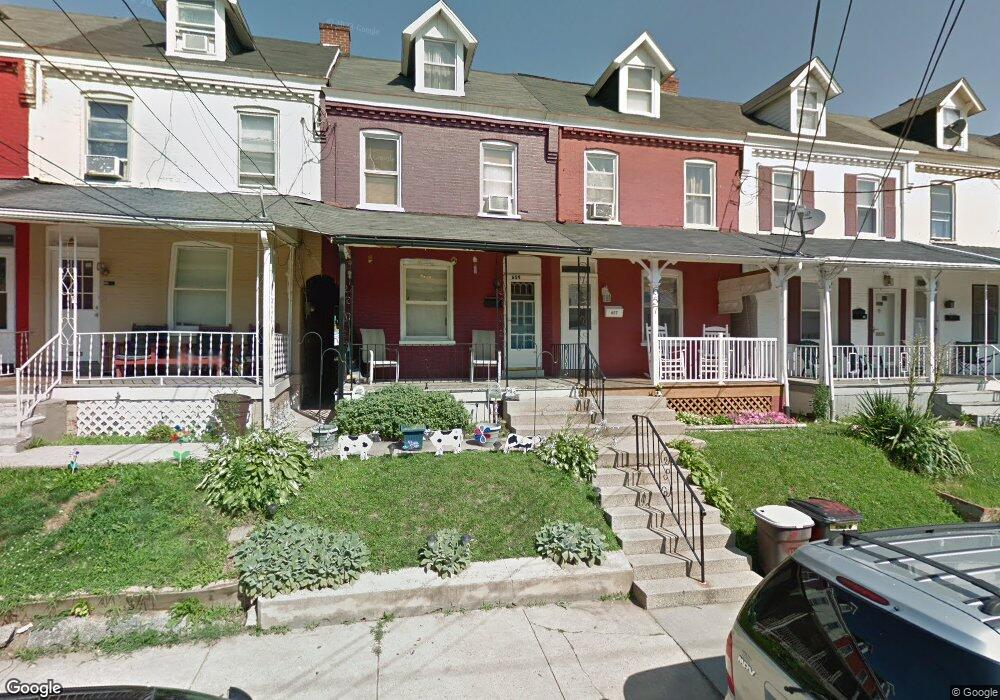
659 Hebrank St Lancaster, PA 17603
Cabbage Hill NeighborhoodEstimated Value: $163,000 - $198,000
2
Beds
1
Bath
1,170
Sq Ft
$151/Sq Ft
Est. Value
About This Home
This home is located at 659 Hebrank St, Lancaster, PA 17603 and is currently estimated at $176,751, approximately $151 per square foot. 659 Hebrank St is a home located in Lancaster County with nearby schools including Price Elementary School, Jackson Middle School, and McCaskey High School.
Ownership History
Date
Name
Owned For
Owner Type
Purchase Details
Closed on
Sep 11, 2023
Sold by
Heisler Elizabeth A
Bought by
Heisler Elizabeth A and Wigman Michael A
Current Estimated Value
Home Financials for this Owner
Home Financials are based on the most recent Mortgage that was taken out on this home.
Original Mortgage
$58,000
Outstanding Balance
$56,770
Interest Rate
6.96%
Mortgage Type
New Conventional
Estimated Equity
$119,981
Purchase Details
Closed on
Jun 30, 1997
Bought by
Heisler Alfred J and Heisler Elizabeth A
Create a Home Valuation Report for This Property
The Home Valuation Report is an in-depth analysis detailing your home's value as well as a comparison with similar homes in the area
Home Values in the Area
Average Home Value in this Area
Purchase History
| Date | Buyer | Sale Price | Title Company |
|---|---|---|---|
| Heisler Elizabeth A | -- | None Listed On Document | |
| Heisler Elizabeth A | -- | None Listed On Document | |
| Heisler Alfred J | $49,900 | -- |
Source: Public Records
Mortgage History
| Date | Status | Borrower | Loan Amount |
|---|---|---|---|
| Open | Heisler Elizabeth A | $58,000 |
Source: Public Records
Tax History Compared to Growth
Tax History
| Year | Tax Paid | Tax Assessment Tax Assessment Total Assessment is a certain percentage of the fair market value that is determined by local assessors to be the total taxable value of land and additions on the property. | Land | Improvement |
|---|---|---|---|---|
| 2025 | $2,263 | $57,200 | $15,000 | $42,200 |
| 2024 | $2,263 | $57,200 | $15,000 | $42,200 |
| 2023 | $2,225 | $57,200 | $15,000 | $42,200 |
| 2022 | $2,133 | $57,200 | $15,000 | $42,200 |
| 2021 | $2,087 | $57,200 | $15,000 | $42,200 |
| 2020 | $2,087 | $57,200 | $15,000 | $42,200 |
| 2019 | $2,056 | $57,200 | $15,000 | $42,200 |
| 2018 | $783 | $57,200 | $15,000 | $42,200 |
| 2017 | $2,839 | $61,800 | $15,200 | $46,600 |
| 2016 | $2,813 | $61,800 | $15,200 | $46,600 |
| 2015 | $1,097 | $61,800 | $15,200 | $46,600 |
| 2014 | $2,027 | $61,800 | $15,200 | $46,600 |
Source: Public Records
Map
Nearby Homes
- 472 New Dorwart St
- 665 Fremont St
- 659 Fremont St
- 706 Poplar St
- 471 New Dorwart St
- 758 Fremont St
- 638 Saint Joseph St
- 429 Hillside Ave
- 634 Saint Joseph St
- 624 Saint Joseph St
- 535 Poplar St
- 533 Poplar St
- 624 W Vine St
- 513 Poplar St
- 632 High St
- 718 High St
- 618 High St
- 458 Poplar St
- 348 S Prince St
- 346 S Prince St