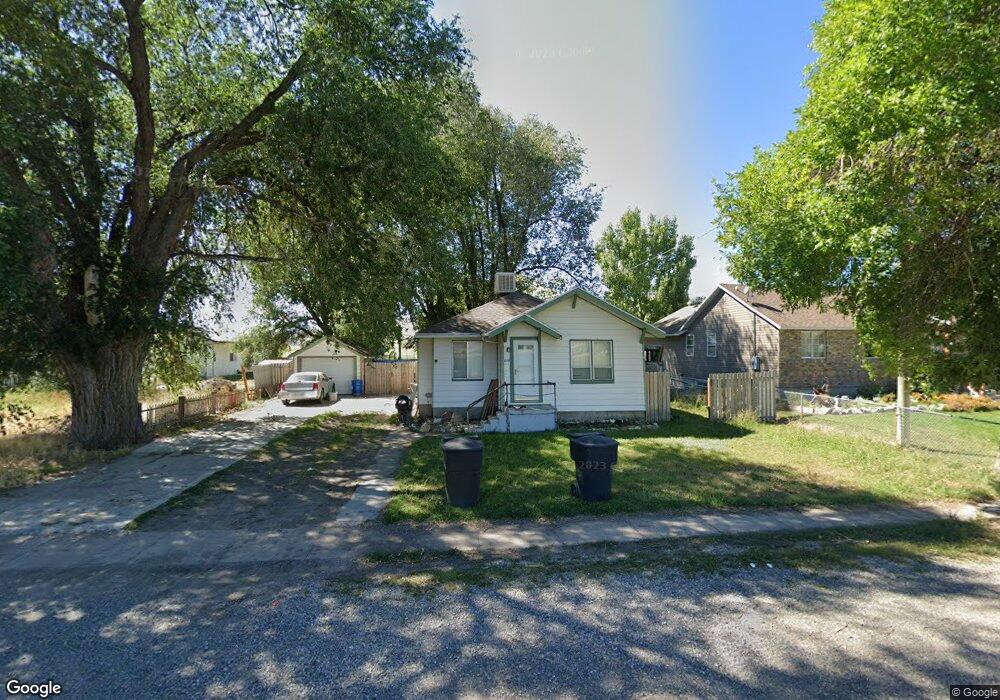
659 N Main St Garland, UT 84312
Estimated Value: $304,000 - $365,000
3
Beds
1
Bath
1,609
Sq Ft
$214/Sq Ft
Est. Value
About This Home
This home is located at 659 N Main St, Garland, UT 84312 and is currently estimated at $343,880, approximately $213 per square foot. 659 N Main St is a home located in Box Elder County with nearby schools including Fielding School, Bear River Middle School, and Alice C. Harris Intermediate School.
Ownership History
Date
Name
Owned For
Owner Type
Purchase Details
Closed on
May 7, 2018
Sold by
Bardwell Cody B
Bought by
Deakin Joseph W and Deakin Suzette
Current Estimated Value
Home Financials for this Owner
Home Financials are based on the most recent Mortgage that was taken out on this home.
Original Mortgage
$100,000
Outstanding Balance
$86,183
Interest Rate
4.44%
Mortgage Type
New Conventional
Estimated Equity
$257,697
Create a Home Valuation Report for This Property
The Home Valuation Report is an in-depth analysis detailing your home's value as well as a comparison with similar homes in the area
Home Values in the Area
Average Home Value in this Area
Purchase History
| Date | Buyer | Sale Price | Title Company |
|---|---|---|---|
| Deakin Joseph W | -- | American Secure Title Tremon |
Source: Public Records
Mortgage History
| Date | Status | Borrower | Loan Amount |
|---|---|---|---|
| Open | Deakin Joseph W | $100,000 |
Source: Public Records
Tax History Compared to Growth
Tax History
| Year | Tax Paid | Tax Assessment Tax Assessment Total Assessment is a certain percentage of the fair market value that is determined by local assessors to be the total taxable value of land and additions on the property. | Land | Improvement |
|---|---|---|---|---|
| 2025 | $1,627 | $286,667 | $105,000 | $181,667 |
| 2024 | $1,627 | $279,381 | $100,000 | $179,381 |
| 2023 | $1,485 | $251,438 | $90,000 | $161,438 |
| 2022 | $1,356 | $215,278 | $30,000 | $185,278 |
| 2021 | $1,099 | $132,460 | $30,000 | $102,460 |
| 2020 | $953 | $132,460 | $30,000 | $102,460 |
| 2019 | $901 | $66,370 | $16,500 | $49,870 |
| 2018 | $649 | $44,677 | $16,500 | $28,177 |
| 2017 | $673 | $81,230 | $16,500 | $51,230 |
| 2016 | $642 | $43,335 | $16,500 | $26,835 |
| 2015 | $616 | $40,895 | $16,500 | $24,395 |
| 2014 | $616 | $39,734 | $16,500 | $23,234 |
| 2013 | -- | $39,734 | $13,338 | $26,396 |
Source: Public Records
Map
Nearby Homes