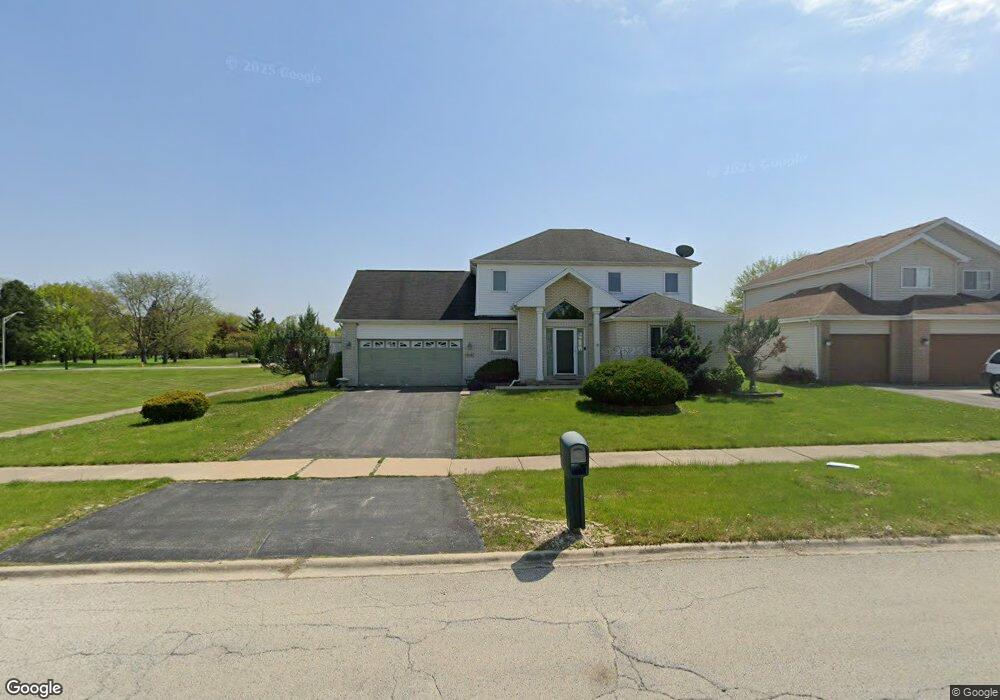
659 Primrose Ln Matteson, IL 60443
Old Matteson NeighborhoodEstimated Value: $289,000 - $346,000
3
Beds
3
Baths
1,767
Sq Ft
$176/Sq Ft
Est. Value
About This Home
This home is located at 659 Primrose Ln, Matteson, IL 60443 and is currently estimated at $311,154, approximately $176 per square foot. 659 Primrose Ln is a home located in Cook County with nearby schools including Illinois School, Arcadia Elementary School, and Indiana Elementary School.
Ownership History
Date
Name
Owned For
Owner Type
Purchase Details
Closed on
Feb 21, 2025
Sold by
Falola Eto
Bought by
Hannah P Family Trust
Current Estimated Value
Purchase Details
Closed on
Oct 15, 2004
Sold by
Adkins George C and Adkins Linda J
Bought by
Falola Eto
Home Financials for this Owner
Home Financials are based on the most recent Mortgage that was taken out on this home.
Original Mortgage
$196,800
Outstanding Balance
$97,726
Interest Rate
5.81%
Mortgage Type
Unknown
Estimated Equity
$213,428
Purchase Details
Closed on
Oct 11, 2002
Sold by
L Waller Enterprises Inc
Bought by
Adkins George and Adkins Linda
Create a Home Valuation Report for This Property
The Home Valuation Report is an in-depth analysis detailing your home's value as well as a comparison with similar homes in the area
Home Values in the Area
Average Home Value in this Area
Purchase History
| Date | Buyer | Sale Price | Title Company |
|---|---|---|---|
| Hannah P Family Trust | -- | None Listed On Document | |
| Falola Eto | $246,000 | Atgf Inc | |
| Adkins George | -- | -- |
Source: Public Records
Mortgage History
| Date | Status | Borrower | Loan Amount |
|---|---|---|---|
| Open | Falola Eto | $196,800 |
Source: Public Records
Tax History Compared to Growth
Tax History
| Year | Tax Paid | Tax Assessment Tax Assessment Total Assessment is a certain percentage of the fair market value that is determined by local assessors to be the total taxable value of land and additions on the property. | Land | Improvement |
|---|---|---|---|---|
| 2024 | $7,867 | $25,000 | $6,600 | $18,400 |
| 2023 | $6,546 | $25,000 | $6,600 | $18,400 |
| 2022 | $6,546 | $18,224 | $5,700 | $12,524 |
| 2021 | $6,725 | $18,223 | $5,700 | $12,523 |
| 2020 | $6,437 | $18,223 | $5,700 | $12,523 |
| 2019 | $6,996 | $19,690 | $5,100 | $14,590 |
| 2018 | $6,989 | $19,690 | $5,100 | $14,590 |
| 2017 | $9,782 | $19,690 | $5,100 | $14,590 |
| 2016 | $8,792 | $17,881 | $4,500 | $13,381 |
| 2015 | $8,716 | $17,881 | $4,500 | $13,381 |
| 2014 | $9,082 | $19,235 | $4,500 | $14,735 |
| 2013 | $8,687 | $20,127 | $4,500 | $15,627 |
Source: Public Records
Map
Nearby Homes
- 663 Primrose Ln
- 820 School Ave
- 4325 Oakwood Ln
- 4329 Applewood Ln
- 858 Academy Ave
- 4228 Applewood Ln
- 4335 Lindenwood Dr
- 706 Carnation Ln
- 4500 203rd St
- 4110 Applewood Ln
- 4108 Applewood Ln
- 4613 Lindenwood Ct
- 312 Grafton Place
- 4700 203rd St
- 20520 Crawford Ave
- 153 Treehouse Rd
- 831 Violet Ln
- 135 Treehouse Rd
- 20340 Crawford Ave
- 820 Exmoor Rd
- 667 Primrose Ln
- 653 Larkspur Ln
- 671 Primrose Ln
- 658 Primrose Ln
- 654 Primrose Ln
- 649 Larkspur Ln
- 675 Primrose Ln
- 650 Primrose Ln
- 4531 207th St
- 670 Primrose Ln
- 645 Larkspur Ln
- 679 Primrose Ln
- 706 School Ave
- 652 Larkspur Ln
- 646 Primrose Ln
- 634 Primrose Cir
- 4539 207th St
- 636 Primrose Cir
- 648 Larkspur Ln
- 722 Campus Ave