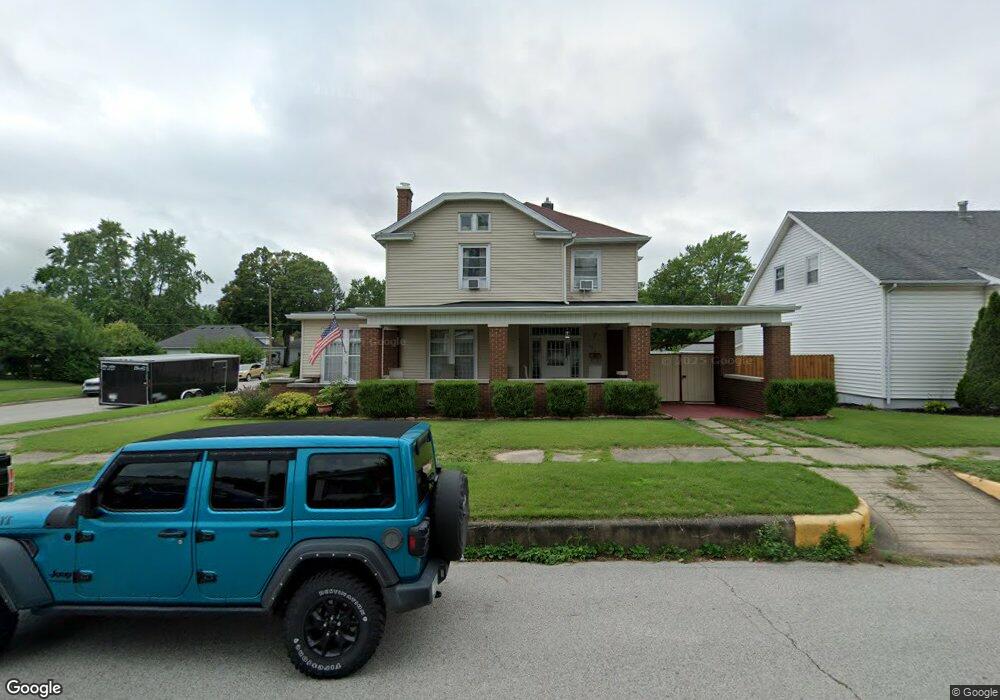
659 S 3rd St Clinton, IN 47842
Estimated Value: $154,000 - $183,695
4
Beds
2
Baths
2,123
Sq Ft
$79/Sq Ft
Est. Value
About This Home
This home is located at 659 S 3rd St, Clinton, IN 47842 and is currently estimated at $168,424, approximately $79 per square foot. 659 S 3rd St is a home located in Vermillion County with nearby schools including South Vermillion High School and Sacred Heart School.
Ownership History
Date
Name
Owned For
Owner Type
Purchase Details
Closed on
Oct 27, 2008
Sold by
Ganene Maas
Bought by
Bradley Hendrix and Hendrix Deborah L
Current Estimated Value
Purchase Details
Closed on
Sep 9, 2008
Sold by
Spence Sheriff Robert
Bought by
Federal National Mortgage Association
Create a Home Valuation Report for This Property
The Home Valuation Report is an in-depth analysis detailing your home's value as well as a comparison with similar homes in the area
Home Values in the Area
Average Home Value in this Area
Purchase History
| Date | Buyer | Sale Price | Title Company |
|---|---|---|---|
| Bradley Hendrix | $46,000 | Security Title Services | |
| Hendrix Bradley | $46,000 | Security Title Services | |
| Federal National Mortgage Association | $68,000 | -- | |
| Federal National Mortgage Association | $68,000 | Feiwell & Hannoy |
Source: Public Records
Tax History
| Year | Tax Paid | Tax Assessment Tax Assessment Total Assessment is a certain percentage of the fair market value that is determined by local assessors to be the total taxable value of land and additions on the property. | Land | Improvement |
|---|---|---|---|---|
| 2025 | $1,433 | $189,400 | $11,800 | $177,600 |
| 2024 | $1,326 | $143,300 | $11,800 | $131,500 |
| 2023 | $1,326 | $132,600 | $11,800 | $120,800 |
| 2022 | $1,318 | $131,800 | $11,800 | $120,000 |
| 2021 | $1,148 | $114,800 | $11,800 | $103,000 |
| 2020 | $995 | $99,500 | $14,600 | $84,900 |
| 2019 | $623 | $67,600 | $6,400 | $61,200 |
| 2018 | $611 | $67,600 | $6,400 | $61,200 |
| 2017 | $559 | $66,700 | $6,400 | $60,300 |
| 2016 | $536 | $64,800 | $6,400 | $58,400 |
| 2014 | $492 | $63,400 | $6,400 | $57,000 |
| 2013 | $492 | $63,400 | $6,400 | $57,000 |
Source: Public Records
Map
Nearby Homes
Your Personal Tour Guide
Ask me questions while you tour the home.