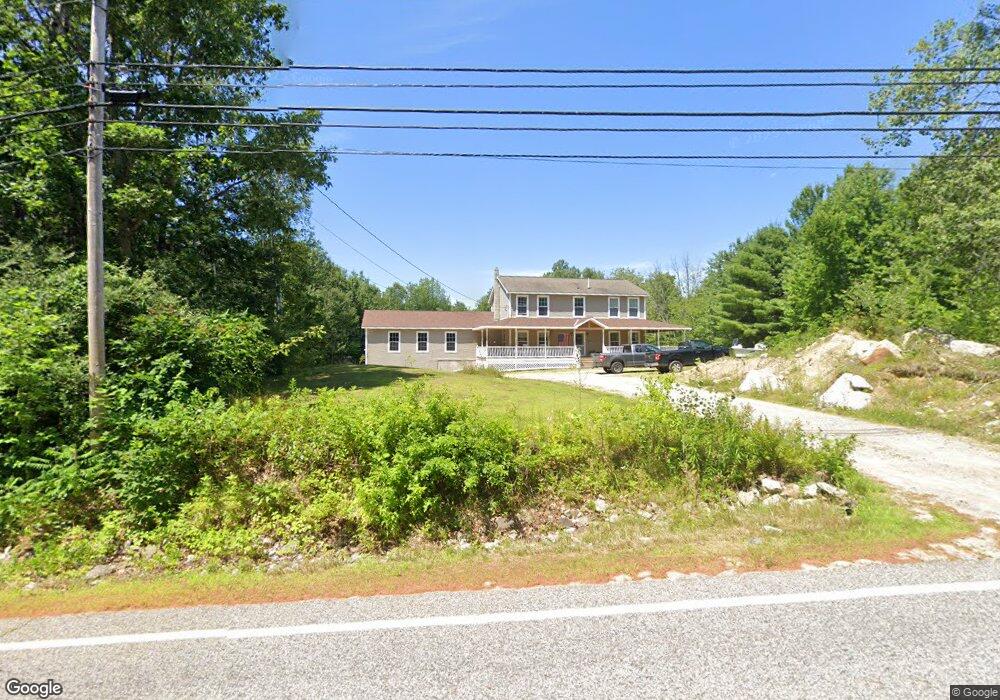
659 S Main St Auburn, ME 04210
Estimated Value: $455,000 - $528,692
4
Beds
3
Baths
2,240
Sq Ft
$218/Sq Ft
Est. Value
About This Home
This home is located at 659 S Main St, Auburn, ME 04210 and is currently estimated at $487,673, approximately $217 per square foot. 659 S Main St is a home located in Androscoggin County with nearby schools including Sherwood Heights Elementary School, Auburn Middle School, and Edward Little High School.
Ownership History
Date
Name
Owned For
Owner Type
Purchase Details
Closed on
Aug 4, 2006
Sold by
Turner William T
Bought by
Daigneault James A and Daigneault Deborah E
Current Estimated Value
Home Financials for this Owner
Home Financials are based on the most recent Mortgage that was taken out on this home.
Original Mortgage
$218,800
Outstanding Balance
$130,935
Interest Rate
6.7%
Mortgage Type
Purchase Money Mortgage
Estimated Equity
$356,738
Create a Home Valuation Report for This Property
The Home Valuation Report is an in-depth analysis detailing your home's value as well as a comparison with similar homes in the area
Home Values in the Area
Average Home Value in this Area
Purchase History
| Date | Buyer | Sale Price | Title Company |
|---|---|---|---|
| Daigneault James A | -- | -- |
Source: Public Records
Mortgage History
| Date | Status | Borrower | Loan Amount |
|---|---|---|---|
| Open | Daigneault James A | $218,800 |
Source: Public Records
Tax History Compared to Growth
Tax History
| Year | Tax Paid | Tax Assessment Tax Assessment Total Assessment is a certain percentage of the fair market value that is determined by local assessors to be the total taxable value of land and additions on the property. | Land | Improvement |
|---|---|---|---|---|
| 2024 | $7,897 | $354,900 | $55,000 | $299,900 |
| 2023 | $7,189 | $316,000 | $48,900 | $267,100 |
| 2022 | $6,891 | $302,900 | $48,900 | $254,000 |
| 2021 | $6,031 | $253,200 | $40,700 | $212,500 |
| 2020 | $5,662 | $238,400 | $40,700 | $197,700 |
| 2019 | $5,662 | $238,400 | $40,700 | $197,700 |
| 2018 | $5,645 | $238,400 | $40,700 | $197,700 |
| 2017 | $5,481 | $238,400 | $40,700 | $197,700 |
| 2016 | $5,456 | $244,100 | $40,800 | $203,300 |
| 2015 | $5,187 | $244,100 | $40,800 | $203,300 |
| 2013 | -- | $244,100 | $40,800 | $203,300 |
Source: Public Records
Map
Nearby Homes