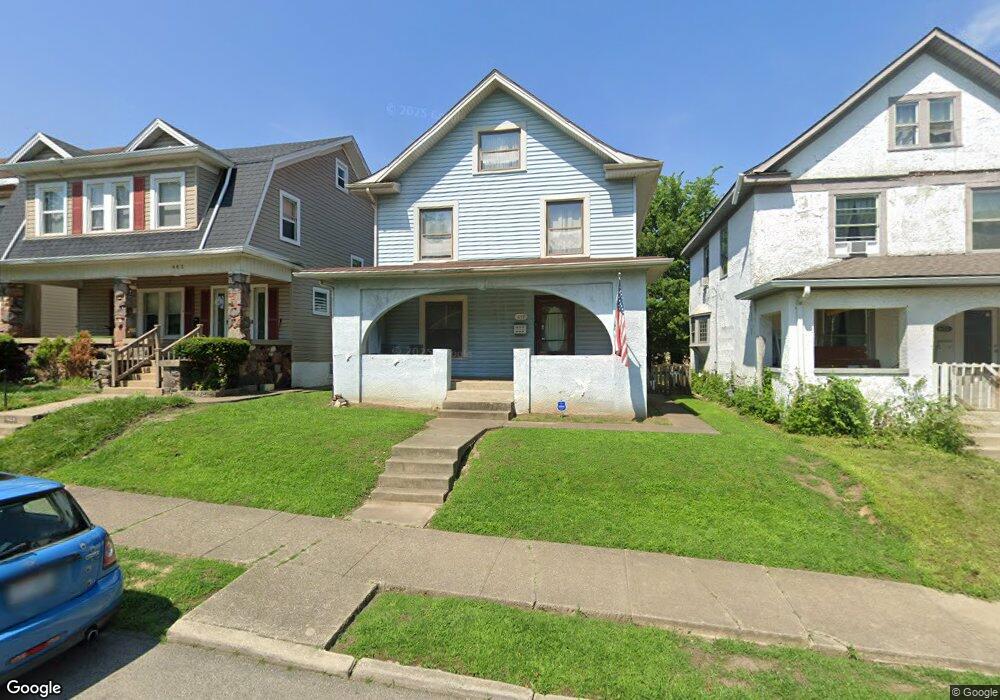
659 Saint Nicholas Ave Dayton, OH 45410
Linden Heights NeighborhoodEstimated Value: $127,000 - $168,000
4
Beds
2
Baths
1,468
Sq Ft
$99/Sq Ft
Est. Value
About This Home
This home is located at 659 Saint Nicholas Ave, Dayton, OH 45410 and is currently estimated at $145,598, approximately $99 per square foot. 659 Saint Nicholas Ave is a home located in Montgomery County with nearby schools including Cleveland Elementary School, Horace Mann Elementary School, and Eastmont Elementary.
Ownership History
Date
Name
Owned For
Owner Type
Purchase Details
Closed on
Sep 11, 2008
Sold by
Pappas Tammy Jo
Bought by
Judah Jeffrey D
Current Estimated Value
Home Financials for this Owner
Home Financials are based on the most recent Mortgage that was taken out on this home.
Original Mortgage
$82,348
Outstanding Balance
$54,851
Interest Rate
6.55%
Mortgage Type
FHA
Estimated Equity
$90,747
Purchase Details
Closed on
Apr 13, 2007
Sold by
Pappas Tammy Jo
Bought by
Pappas Tammy Jo
Purchase Details
Closed on
Jan 31, 2003
Sold by
Thompson John R
Bought by
Thompson Tammy Jo
Purchase Details
Closed on
Jan 3, 2002
Sold by
Thompson John R
Bought by
Tammy Jo Thompson Living Trust
Purchase Details
Closed on
Nov 24, 1996
Sold by
Thompson John R and Thompson Tammy J
Bought by
Thompson Tammy Jo and Thompson John R
Create a Home Valuation Report for This Property
The Home Valuation Report is an in-depth analysis detailing your home's value as well as a comparison with similar homes in the area
Home Values in the Area
Average Home Value in this Area
Purchase History
| Date | Buyer | Sale Price | Title Company |
|---|---|---|---|
| Judah Jeffrey D | $83,000 | Attorney | |
| Pappas Tammy Jo | -- | None Available | |
| Thompson Tammy Jo | -- | -- | |
| Tammy Jo Thompson Living Trust | -- | -- | |
| Thompson Tammy Jo | -- | -- |
Source: Public Records
Mortgage History
| Date | Status | Borrower | Loan Amount |
|---|---|---|---|
| Open | Judah Jeffrey D | $82,348 |
Source: Public Records
Tax History Compared to Growth
Tax History
| Year | Tax Paid | Tax Assessment Tax Assessment Total Assessment is a certain percentage of the fair market value that is determined by local assessors to be the total taxable value of land and additions on the property. | Land | Improvement |
|---|---|---|---|---|
| 2024 | $2,247 | $40,080 | $7,710 | $32,370 |
| 2023 | $2,247 | $40,080 | $7,710 | $32,370 |
| 2022 | $1,916 | $26,380 | $5,080 | $21,300 |
| 2021 | $1,906 | $26,380 | $5,080 | $21,300 |
| 2020 | $1,905 | $26,380 | $5,080 | $21,300 |
| 2019 | $1,713 | $21,420 | $3,630 | $17,790 |
| 2018 | $1,716 | $21,420 | $3,630 | $17,790 |
| 2017 | $1,702 | $21,420 | $3,630 | $17,790 |
| 2016 | $1,714 | $20,510 | $3,630 | $16,880 |
| 2015 | $1,621 | $20,510 | $3,630 | $16,880 |
| 2014 | $1,621 | $20,510 | $3,630 | $16,880 |
| 2012 | -- | $18,680 | $5,710 | $12,970 |
Source: Public Records
Map
Nearby Homes
- 708 Saint Nicholas Ave
- 722 Saint Nicholas Ave
- 624 Pritz Ave
- 621 Creighton Ave
- 626 Creighton Ave
- 607 Carlisle Ave
- 1609 Xenia Ave
- 662 Carlisle Ave
- 1018 Haviland Ave
- 630 Carlisle Ave
- 1024 Haviland Ave
- 523 Carlisle Ave
- 1708 Xenia Ave
- 2012 Saint Charles Ave
- 853 Carlisle Ave
- 716 Hodapp Ave
- 800 Linden Ave
- 2105 Wyoming St
- 914 Linden Ave
- 636 Wilfred Ave
- 655 Saint Nicholas Ave
- 667 Saint Nicholas Ave
- 647 Saint Nicholas Ave
- 643 Saint Nicholas Ave
- 703 Saint Nicholas Ave
- 701 Saint Nicholas Ave
- 639 Saint Nicholas Ave
- 656 Saint Nicholas Ave
- 660 Saint Nicholas Ave
- 652 Saint Nicholas Ave
- 707 Saint Nicholas Ave
- 664 Saint Nicholas Ave
- 650 Saint Nicholas Ave
- 646 Saint Nicholas Ave
- 635 Saint Nicholas Ave
- 711 Saint Nicholas Ave
- 642 Saint Nicholas Ave
- 658 Pritz Ave
- 654 Pritz Ave
- 1702 Tacoma St