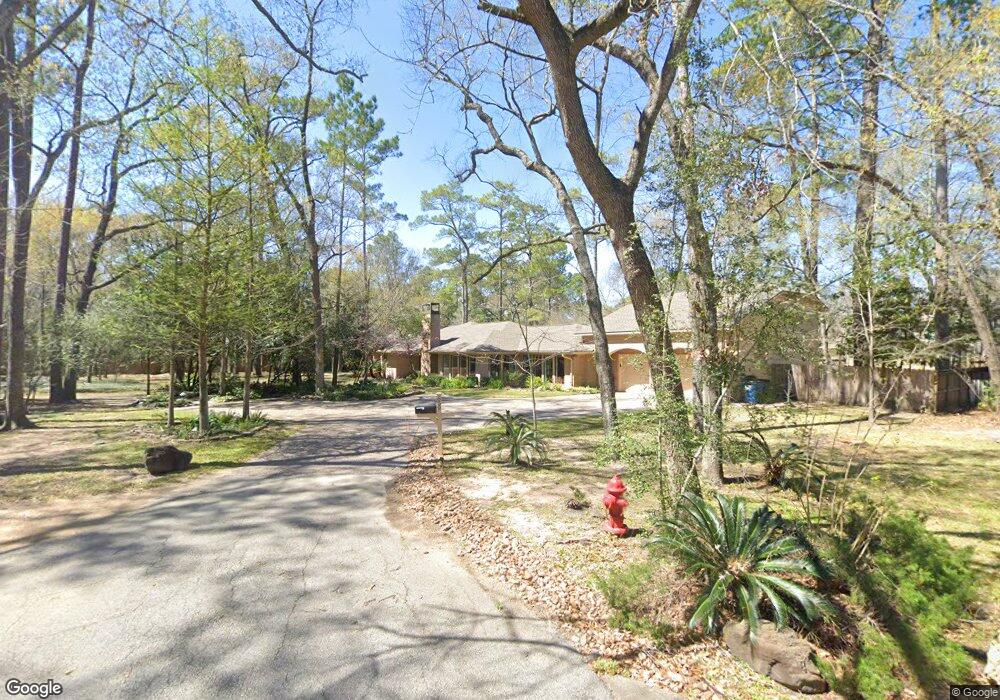
659 Strey Ln Houston, TX 77024
Estimated Value: $2,035,655 - $2,597,000
5
Beds
4
Baths
3,736
Sq Ft
$614/Sq Ft
Est. Value
About This Home
This home is located at 659 Strey Ln, Houston, TX 77024 and is currently estimated at $2,292,914, approximately $613 per square foot. 659 Strey Ln is a home located in Harris County with nearby schools including Bunker Hill Elementary School, Memorial Middle, and Memorial High School.
Ownership History
Date
Name
Owned For
Owner Type
Purchase Details
Closed on
Jun 24, 2008
Sold by
Nosrat Amin R
Bought by
Nosrat Janet K
Current Estimated Value
Purchase Details
Closed on
Sep 12, 1997
Sold by
Pascoe John B
Bought by
Nosrat Amin R and Nosrat Janet K
Home Financials for this Owner
Home Financials are based on the most recent Mortgage that was taken out on this home.
Original Mortgage
$380,000
Interest Rate
7.48%
Purchase Details
Closed on
Jan 31, 1996
Sold by
Kain John Owen
Bought by
Pascoe John B
Home Financials for this Owner
Home Financials are based on the most recent Mortgage that was taken out on this home.
Original Mortgage
$140,000
Interest Rate
7.19%
Mortgage Type
Balloon
Create a Home Valuation Report for This Property
The Home Valuation Report is an in-depth analysis detailing your home's value as well as a comparison with similar homes in the area
Home Values in the Area
Average Home Value in this Area
Purchase History
| Date | Buyer | Sale Price | Title Company |
|---|---|---|---|
| Nosrat Janet K | -- | None Available | |
| Nosrat Amin R | -- | -- | |
| Pascoe John B | -- | First American Title |
Source: Public Records
Mortgage History
| Date | Status | Borrower | Loan Amount |
|---|---|---|---|
| Previous Owner | Nosrat Amin R | $380,000 | |
| Previous Owner | Pascoe John B | $140,000 |
Source: Public Records
Tax History Compared to Growth
Tax History
| Year | Tax Paid | Tax Assessment Tax Assessment Total Assessment is a certain percentage of the fair market value that is determined by local assessors to be the total taxable value of land and additions on the property. | Land | Improvement |
|---|---|---|---|---|
| 2025 | $23,863 | $2,039,383 | $1,336,194 | $703,189 |
| 2024 | $23,863 | $1,745,355 | $1,291,654 | $453,701 |
| 2023 | $23,863 | $1,725,919 | $1,224,845 | $501,074 |
| 2022 | $30,812 | $1,699,128 | $1,224,845 | $474,283 |
| 2021 | $29,175 | $1,347,157 | $1,036,136 | $311,021 |
| 2020 | $32,037 | $1,446,557 | $1,036,136 | $410,421 |
| 2019 | $31,209 | $1,386,223 | $1,036,136 | $350,087 |
| 2018 | $6,250 | $1,230,000 | $1,036,136 | $193,864 |
| 2017 | $28,372 | $1,230,000 | $1,036,136 | $193,864 |
| 2016 | $28,297 | $1,230,000 | $1,036,136 | $193,864 |
| 2015 | $19,127 | $1,230,000 | $1,036,136 | $193,864 |
| 2014 | $19,127 | $1,214,927 | $896,657 | $318,270 |
Source: Public Records
Map
Nearby Homes
- 601 Strey Ln
- 12222 Broken Bough Dr
- 11910 Heritage Ln
- 12231 Kimberley Ln
- 12003 Tall Oaks St
- 12326 Old Oaks Dr
- 11933 Barryknoll Ln
- 12 Gage Ct
- 12406 Overcup Dr
- 11905 Barryknoll Ln
- 12318 Queensbury Ln
- 711 Timber Hill Dr
- 12315 Barryknoll Ln
- 12334 Beauregard Dr
- 827 Bunker Hill Rd
- 939 Memorial Village Dr Unit 38
- 826 Bunker Hill Rd
- 11718 Broken Bough Cir
- 11801 Barryknoll Ln
- 902 Memorial Village Dr Unit 66
- 663 Strey Ln
- 12015 Taylorcrest Ct
- 12011 Taylorcrest Ct
- 661 Strey Ln
- 12102 Broken Arrow St
- 12103 Broken Bough Dr
- 12107 Broken Bough Dr
- 12010 Cobblestone Dr
- 12106 Broken Arrow St
- 12007 Taylorcrest Ct
- 12019 Taylorcrest Ct
- 12111 Broken Bough Dr
- 12006 Cobblestone Dr
- 12015 Cobblestone Dr
- 12110 Broken Arrow St
- 657 Strey Ln
- 12111 Broken Arrow St
- 12118 Broken Bough Dr
- 12107 Taylorcrest Rd
- 653 Strey Ln