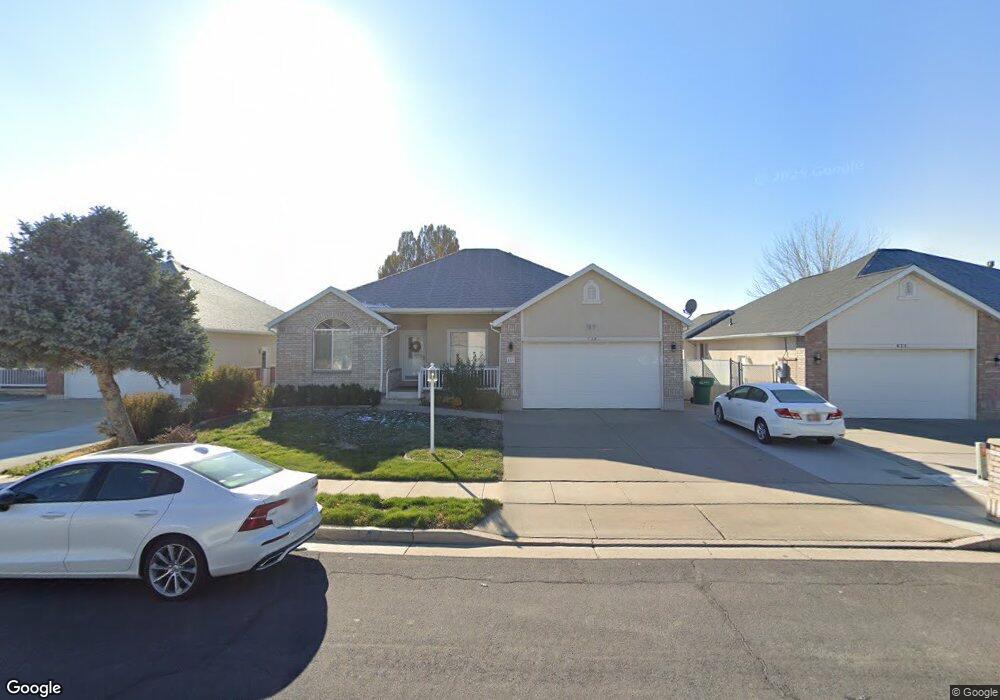
659 W 2325 N Layton, UT 84041
Estimated Value: $504,000 - $568,358
3
Beds
3
Baths
3,126
Sq Ft
$175/Sq Ft
Est. Value
About This Home
This home is located at 659 W 2325 N, Layton, UT 84041 and is currently estimated at $547,340, approximately $175 per square foot. 659 W 2325 N is a home located in Davis County with nearby schools including Lincoln Elementary School, North Layton Junior High School, and Northridge High School.
Ownership History
Date
Name
Owned For
Owner Type
Purchase Details
Closed on
Feb 7, 2025
Sold by
Kwon Sang Ae
Bought by
Sa Kwon Living Trust and Kwon
Current Estimated Value
Purchase Details
Closed on
Jun 20, 2018
Sold by
Kwon Dong Yeon
Bought by
Kwon Sang Ae
Home Financials for this Owner
Home Financials are based on the most recent Mortgage that was taken out on this home.
Original Mortgage
$256,000
Interest Rate
4.6%
Mortgage Type
New Conventional
Purchase Details
Closed on
May 22, 2012
Sold by
Kwon Sangae
Bought by
Kwon Sangae and Kwon Dong Yeon
Home Financials for this Owner
Home Financials are based on the most recent Mortgage that was taken out on this home.
Original Mortgage
$178,000
Interest Rate
3.85%
Mortgage Type
New Conventional
Purchase Details
Closed on
May 25, 1999
Sold by
Norman Larry L and Norman Mary L
Bought by
Norman Larry L and Norman Mary L
Purchase Details
Closed on
Jul 17, 1998
Sold by
William Bend Inc
Bought by
Norman Larry L and Norman Mary L
Create a Home Valuation Report for This Property
The Home Valuation Report is an in-depth analysis detailing your home's value as well as a comparison with similar homes in the area
Home Values in the Area
Average Home Value in this Area
Purchase History
| Date | Buyer | Sale Price | Title Company |
|---|---|---|---|
| Sa Kwon Living Trust | -- | None Listed On Document | |
| Kwon Sang Ae | -- | -- | |
| Kwon Sangae | -- | Magellan Title | |
| Kwon Sangae | -- | Mountain View Title | |
| Norman Larry L | -- | -- | |
| Norman Larry L | -- | Mountain View Title & Escrow |
Source: Public Records
Mortgage History
| Date | Status | Borrower | Loan Amount |
|---|---|---|---|
| Previous Owner | Kwon Sang Ae | $256,000 | |
| Previous Owner | Kwon Sangae | $178,000 |
Source: Public Records
Tax History Compared to Growth
Tax History
| Year | Tax Paid | Tax Assessment Tax Assessment Total Assessment is a certain percentage of the fair market value that is determined by local assessors to be the total taxable value of land and additions on the property. | Land | Improvement |
|---|---|---|---|---|
| 2025 | $2,735 | $287,100 | $92,349 | $194,751 |
| 2024 | $2,611 | $276,100 | $108,159 | $167,941 |
| 2023 | $2,699 | $503,000 | $133,835 | $369,165 |
| 2022 | $2,777 | $281,050 | $69,182 | $211,868 |
| 2021 | $2,517 | $380,000 | $92,997 | $287,003 |
| 2020 | $2,293 | $332,000 | $79,934 | $252,066 |
| 2019 | $2,207 | $313,000 | $77,485 | $235,515 |
| 2018 | $2,030 | $289,000 | $77,485 | $211,515 |
| 2016 | $1,963 | $144,211 | $23,656 | $120,555 |
| 2015 | $1,879 | $131,011 | $23,656 | $107,355 |
| 2014 | $1,851 | $131,946 | $23,656 | $108,290 |
| 2013 | -- | $120,193 | $22,179 | $98,014 |
Source: Public Records
Map
Nearby Homes
- 2211 N 525 W
- 2248 N 500 W
- 2149 N 750 W
- 506 W 2200 N
- 2233 N 475 W
- 2298 N 1085 W
- 2875 N Hill Field Rd Unit 17
- 2875 N Hill Field Rd Unit 199
- 2875 N Hill Field Rd Unit 58
- 2875 N Hill Field Rd Unit 62
- 2875 N Hill Field Rd Unit 40
- 1155 W 2200 N
- 538 W 1875 N
- 2600 N Hill Field Rd Unit 108
- 2600 N Hill Field Rd Unit 4
- 95 W 2400 N
- 61 Sunset Dr
- 2053 Evans Cove Loop Unit 39
- 2500 N Fort Ln Unit 238
- 141 Cushing Way