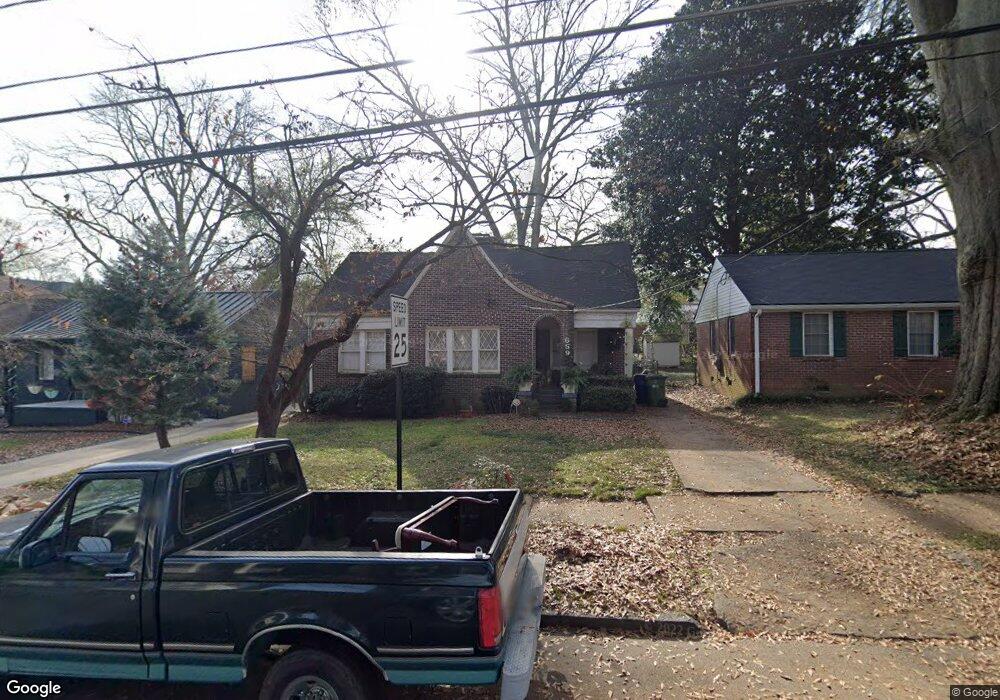
659 Willoughby Way NE Atlanta, GA 30312
Old Fourth Ward NeighborhoodEstimated Value: $662,000 - $1,292,000
2
Beds
1
Bath
3,166
Sq Ft
$309/Sq Ft
Est. Value
About This Home
This home is located at 659 Willoughby Way NE, Atlanta, GA 30312 and is currently estimated at $977,808, approximately $308 per square foot. 659 Willoughby Way NE is a home located in Fulton County with nearby schools including The John Hope-Charles Walter Hill Elementary Schools, Midtown High School, and Kindezi Old 4th Ward.
Ownership History
Date
Name
Owned For
Owner Type
Purchase Details
Closed on
Sep 13, 2022
Sold by
Sturm Kimberly
Bought by
Sturm Kimberly and Mostoller Quentin
Current Estimated Value
Home Financials for this Owner
Home Financials are based on the most recent Mortgage that was taken out on this home.
Original Mortgage
$760,000
Outstanding Balance
$725,387
Interest Rate
5.13%
Mortgage Type
New Conventional
Estimated Equity
$252,421
Purchase Details
Closed on
Dec 16, 2005
Sold by
Hellenga Hugh
Bought by
Sturm Kimberly
Home Financials for this Owner
Home Financials are based on the most recent Mortgage that was taken out on this home.
Original Mortgage
$215,200
Interest Rate
6.13%
Mortgage Type
New Conventional
Purchase Details
Closed on
May 20, 2004
Sold by
Vermont Robert A
Bought by
Hellenga Hugh
Home Financials for this Owner
Home Financials are based on the most recent Mortgage that was taken out on this home.
Original Mortgage
$183,200
Interest Rate
5.13%
Mortgage Type
New Conventional
Purchase Details
Closed on
Aug 6, 1999
Sold by
Younker Tom B
Bought by
Vermont Robert A
Home Financials for this Owner
Home Financials are based on the most recent Mortgage that was taken out on this home.
Original Mortgage
$150,000
Interest Rate
7.65%
Mortgage Type
New Conventional
Create a Home Valuation Report for This Property
The Home Valuation Report is an in-depth analysis detailing your home's value as well as a comparison with similar homes in the area
Home Values in the Area
Average Home Value in this Area
Purchase History
| Date | Buyer | Sale Price | Title Company |
|---|---|---|---|
| Sturm Kimberly | -- | -- | |
| Sturm Kimberly | $269,000 | -- | |
| Hellenga Hugh | $229,000 | -- | |
| Vermont Robert A | $175,000 | -- |
Source: Public Records
Mortgage History
| Date | Status | Borrower | Loan Amount |
|---|---|---|---|
| Open | Sturm Kimberly | $760,000 | |
| Previous Owner | Sturm Kimberly | $215,200 | |
| Previous Owner | Hellenga Hugh | $183,200 | |
| Previous Owner | Vermont Robert A | $150,000 |
Source: Public Records
Tax History Compared to Growth
Tax History
| Year | Tax Paid | Tax Assessment Tax Assessment Total Assessment is a certain percentage of the fair market value that is determined by local assessors to be the total taxable value of land and additions on the property. | Land | Improvement |
|---|---|---|---|---|
| 2025 | $8,279 | $351,720 | $48,080 | $303,640 |
| 2023 | $8,174 | $197,440 | $89,000 | $108,440 |
| 2022 | $4,767 | $169,600 | $59,600 | $110,000 |
| 2021 | $4,784 | $203,720 | $59,600 | $144,120 |
| 2020 | $4,806 | $174,000 | $55,240 | $118,760 |
| 2019 | $485 | $174,000 | $55,240 | $118,760 |
| 2018 | $4,067 | $174,000 | $55,240 | $118,760 |
| 2017 | $4,202 | $127,160 | $40,440 | $86,720 |
| 2016 | $4,197 | $127,160 | $40,440 | $86,720 |
| 2015 | $4,678 | $127,160 | $40,440 | $86,720 |
| 2014 | $2,331 | $127,160 | $40,440 | $86,720 |
Source: Public Records
Map
Nearby Homes
- 345 Glen Iris Dr NE Unit 3
- 612 Fortune Place NE
- 563 Ralph McGill Blvd NE
- 542 Ralph McGill Blvd NE Unit 7
- 575 Highland Ave NE
- 546 Highland Ave NE
- 630 John Wesley Dobbs Ave NE
- 545 Angier Ave NE
- 536 Highland Ave NE Unit A
- 747 Ralph McGill Blvd NE Unit 223
- 226 Inman Ln NE
- 200 N Highland Ave NE Unit 207
- 870 Inman Village Pkwy NE Unit 321
- 870 Inman Village Pkwy NE Unit 305
- 870 Inman Village Pkwy NE Unit 212
- 870 Inman Village Pkwy NE Unit 203
- 568 John Wesley Dobbs Ave NE
- 638 McGruder St NE
- 665 Willoughby Way NE
- 669 Willoughby Way NE
- 649 Willoughby Way NE
- 660 East Ave NE
- 656 East Ave NE
- 664 East Ave NE
- 660 Willoughby Way NE
- 675 Willoughby Way NE
- 650 East Ave NE
- 670 East Ave NE
- 664 Willoughby Way NE
- 645 Willoughby Way NE
- 655 Ralph McGill Blvd NE
- 646 East Ave NE
- 679 Willoughby Way NE
- 676 East Ave NE
- 659 Ralph McGill Blvd NE
- 640 East Ave NE
- 637 Willoughby Way NE