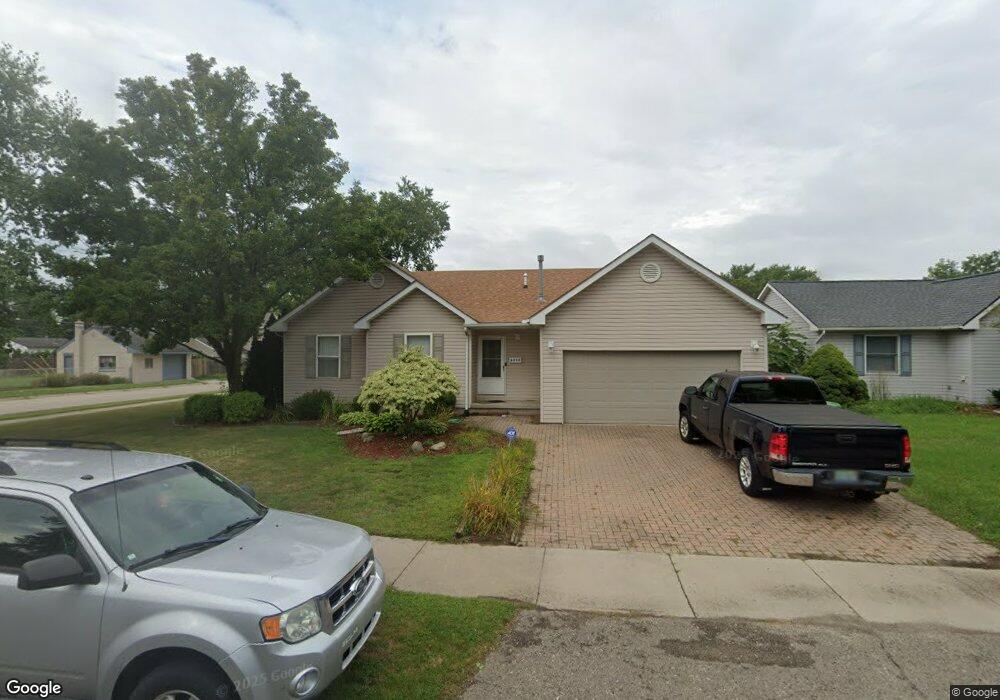
6590 Elm St Taylor, MI 48180
Estimated Value: $183,000 - $227,000
3
Beds
2
Baths
1,432
Sq Ft
$146/Sq Ft
Est. Value
About This Home
This home is located at 6590 Elm St, Taylor, MI 48180 and is currently estimated at $208,772, approximately $145 per square foot. 6590 Elm St is a home located in Wayne County with nearby schools including Clarence Randall Elementary School, Hoover Middle School, and Quest Charter Academy.
Ownership History
Date
Name
Owned For
Owner Type
Purchase Details
Closed on
Nov 4, 2014
Sold by
Goins Andrew M and Goins Stephanie A
Bought by
Goins Andrew M
Current Estimated Value
Home Financials for this Owner
Home Financials are based on the most recent Mortgage that was taken out on this home.
Original Mortgage
$95,550
Outstanding Balance
$73,113
Interest Rate
3.97%
Mortgage Type
New Conventional
Estimated Equity
$135,659
Purchase Details
Closed on
Dec 15, 2003
Sold by
Craig Jason and Craig Amanda
Bought by
Goins Andrew M
Create a Home Valuation Report for This Property
The Home Valuation Report is an in-depth analysis detailing your home's value as well as a comparison with similar homes in the area
Home Values in the Area
Average Home Value in this Area
Purchase History
| Date | Buyer | Sale Price | Title Company |
|---|---|---|---|
| Goins Andrew M | -- | Title Source Inc | |
| Goins Andrew M | $138,000 | Multiple |
Source: Public Records
Mortgage History
| Date | Status | Borrower | Loan Amount |
|---|---|---|---|
| Open | Goins Andrew M | $95,550 |
Source: Public Records
Tax History Compared to Growth
Tax History
| Year | Tax Paid | Tax Assessment Tax Assessment Total Assessment is a certain percentage of the fair market value that is determined by local assessors to be the total taxable value of land and additions on the property. | Land | Improvement |
|---|---|---|---|---|
| 2025 | $2,198 | $116,600 | $0 | $0 |
| 2024 | $2,198 | $103,800 | $0 | $0 |
| 2023 | $2,639 | $93,100 | $0 | $0 |
| 2022 | $2,098 | $84,700 | $0 | $0 |
| 2021 | $2,320 | $77,300 | $0 | $0 |
| 2020 | $2,297 | $69,200 | $0 | $0 |
| 2019 | $229,548 | $56,300 | $0 | $0 |
| 2018 | $1,801 | $43,600 | $0 | $0 |
| 2017 | $1,003 | $44,100 | $0 | $0 |
| 2016 | $2,243 | $42,800 | $0 | $0 |
| 2015 | $4,070 | $40,700 | $0 | $0 |
| 2013 | $4,110 | $42,600 | $0 | $0 |
| 2012 | $1,801 | $41,800 | $13,900 | $27,900 |
Source: Public Records
Map
Nearby Homes