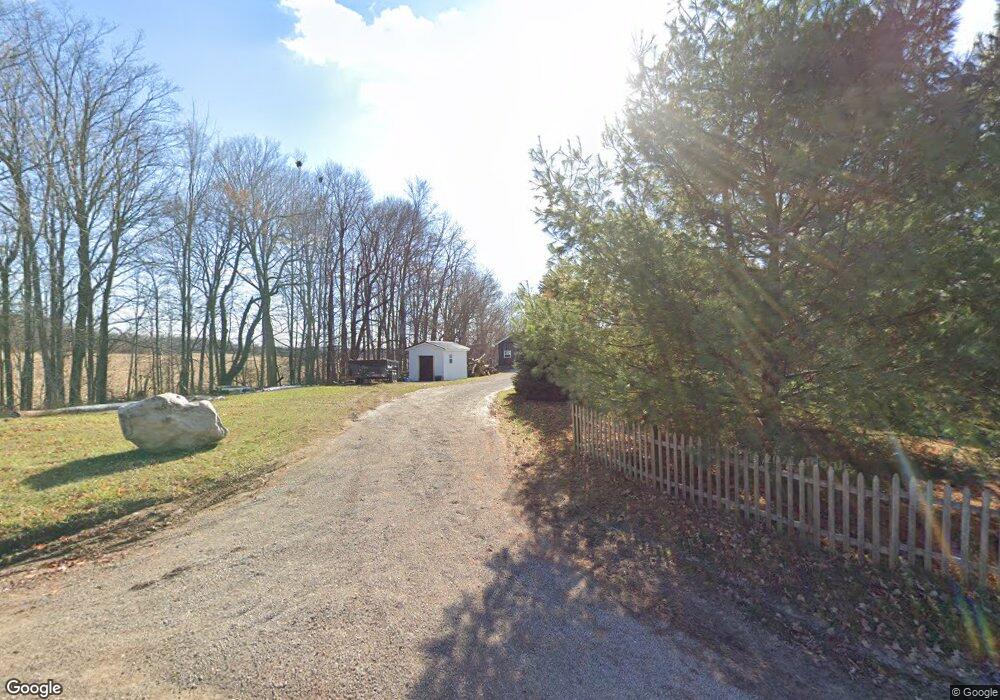
6590 Township Road 119 Mount Gilead, OH 43338
Estimated Value: $204,342 - $362,000
2
Beds
2
Baths
1,600
Sq Ft
$173/Sq Ft
Est. Value
About This Home
This home is located at 6590 Township Road 119, Mount Gilead, OH 43338 and is currently estimated at $276,836, approximately $173 per square foot. 6590 Township Road 119 is a home located in Morrow County with nearby schools including Highland Elementary School, Highland Middle School, and Highland High School.
Ownership History
Date
Name
Owned For
Owner Type
Purchase Details
Closed on
Sep 12, 2022
Sold by
Yoder Noah J and Yoder Miriam D
Bought by
Troyer Simon A and Troyer Verna L
Current Estimated Value
Purchase Details
Closed on
Feb 20, 2020
Sold by
Usa Hud
Bought by
Yoder Noah J and Yoder Mariam D
Purchase Details
Closed on
Sep 5, 2019
Sold by
Wells Fargo Bank Na
Bought by
Usa Hud
Purchase Details
Closed on
Apr 7, 2015
Sold by
Beheler Christifer L
Bought by
Geyer Julie W
Home Financials for this Owner
Home Financials are based on the most recent Mortgage that was taken out on this home.
Interest Rate
3.7%
Purchase Details
Closed on
Jul 2, 2010
Sold by
Beheler Julie W
Bought by
Beheler Christifer L
Purchase Details
Closed on
Oct 8, 2002
Sold by
Eckert Michael D And
Bought by
Beheler Christifer L and Beheler Julie W
Purchase Details
Closed on
May 8, 1996
Bought by
Eckert Michael D And
Create a Home Valuation Report for This Property
The Home Valuation Report is an in-depth analysis detailing your home's value as well as a comparison with similar homes in the area
Home Values in the Area
Average Home Value in this Area
Purchase History
| Date | Buyer | Sale Price | Title Company |
|---|---|---|---|
| Troyer Simon A | $170,000 | -- | |
| Yoder Noah J | $38,000 | None Available | |
| Usa Hud | -- | Boston National Title | |
| Geyer Julie W | -- | -- | |
| Beheler Christifer L | -- | -- | |
| Beheler Christifer L | $99,900 | -- | |
| Eckert Michael D And | $13,900 | -- |
Source: Public Records
Mortgage History
| Date | Status | Borrower | Loan Amount |
|---|---|---|---|
| Previous Owner | Geyer Julie W | -- |
Source: Public Records
Tax History Compared to Growth
Tax History
| Year | Tax Paid | Tax Assessment Tax Assessment Total Assessment is a certain percentage of the fair market value that is determined by local assessors to be the total taxable value of land and additions on the property. | Land | Improvement |
|---|---|---|---|---|
| 2024 | $2,243 | $60,520 | $19,670 | $40,850 |
| 2023 | $2,243 | $60,520 | $19,670 | $40,850 |
| 2022 | $2,160 | $51,310 | $12,950 | $38,360 |
| 2021 | $1,586 | $37,770 | $12,950 | $24,820 |
| 2020 | $1,570 | $37,770 | $12,950 | $24,820 |
| 2019 | $1,420 | $33,400 | $11,450 | $21,950 |
| 2018 | $1,421 | $33,400 | $11,450 | $21,950 |
| 2017 | $1,405 | $33,400 | $11,450 | $21,950 |
| 2016 | $1,409 | $33,640 | $10,010 | $23,630 |
| 2015 | $1,320 | $33,640 | $10,010 | $23,630 |
| 2014 | $1,342 | $33,640 | $10,010 | $23,630 |
| 2013 | $1,345 | $35,390 | $10,540 | $24,850 |
Source: Public Records
Map
Nearby Homes
- 00 County Road 98 Unit Lot B
- 000 County Road 98 Unit Lot C
- 0 County Road 98 Unit Lot A
- 6528 Township Road 14
- 5953 County Road 109
- 5615 County Road 98
- 5491 Township Road 14
- 5343 State Route 95
- 0 State Route 61 Unit 9066611
- 4089 State Route 314
- 4011 State Route 314
- VL Twp Rd 165
- 5329 Township Road 115
- 6043 Township Road 87
- 5643 Yankee St
- 6351 U S 42
- 6410 Township Road 84
- 5545 County Road 240-Bryn Zion Rd
- 7326 State Route 19 Unit 1 Lots 62-63
- 6640 County Road 23
- 5002 Township Road 96
- 5002 Twp 96 Rd
- 6590 Twp 119 Rd
- 6620 Township Road 119
- 6450 Township Road 119
- 6640 Township Road 119
- 6740 Township Road 119
- 6740 Township Road 119
- 5090 Township Road 96
- 6505 County Road 109
- 6544 County Road 109
- 6503 Twp 119 Rd
- 5096 Township Road 96
- 5096 Township Road 96
- 5100 Township Road 96
- 5096 Twp Rd Unit 96
- 5096 Twp Rd
- 5144 Township Road 96
- 6791 Township Road 119
- 4826 Township Road 96