65923 Rimrock Ct Bend, OR 97701
Juniper Preserve NeighborhoodEstimated Value: $2,247,639 - $2,509,000
2
Beds
5
Baths
5,234
Sq Ft
$450/Sq Ft
Est. Value
About This Home
This home is located at 65923 Rimrock Ct, Bend, OR 97701 and is currently estimated at $2,354,213, approximately $449 per square foot. 65923 Rimrock Ct is a home located in Deschutes County with nearby schools including Tumalo Community School, Obsidian Middle School, and Ridgeview High School.
Ownership History
Date
Name
Owned For
Owner Type
Purchase Details
Closed on
Aug 17, 2012
Sold by
Carpenter Richard L and Carpenter Jelinda S
Bought by
Carpenter Richard L and Richard L Carpenter Revocable Living Tru
Current Estimated Value
Home Financials for this Owner
Home Financials are based on the most recent Mortgage that was taken out on this home.
Original Mortgage
$375,000
Outstanding Balance
$248,853
Interest Rate
2.87%
Mortgage Type
New Conventional
Estimated Equity
$2,105,360
Purchase Details
Closed on
Jan 13, 2010
Sold by
Carpenter Richard L and Carpenter Jelinda S
Bought by
Carpenter Richard L and Carpenter Jelinda S
Purchase Details
Closed on
Oct 10, 2005
Sold by
Pronghorn Investors Llc
Bought by
Carpenter Richard L and Carpenter Jelinda S
Create a Home Valuation Report for This Property
The Home Valuation Report is an in-depth analysis detailing your home's value as well as a comparison with similar homes in the area
Home Values in the Area
Average Home Value in this Area
Purchase History
| Date | Buyer | Sale Price | Title Company |
|---|---|---|---|
| Carpenter Richard L | -- | First American Title | |
| Carpenter Richard L | -- | First American Title | |
| Carpenter Richard L | -- | Accommodation | |
| Carpenter Richard L | $350,000 | Western Title & Escrow Co |
Source: Public Records
Mortgage History
| Date | Status | Borrower | Loan Amount |
|---|---|---|---|
| Open | Carpenter Richard L | $375,000 |
Source: Public Records
Tax History Compared to Growth
Tax History
| Year | Tax Paid | Tax Assessment Tax Assessment Total Assessment is a certain percentage of the fair market value that is determined by local assessors to be the total taxable value of land and additions on the property. | Land | Improvement |
|---|---|---|---|---|
| 2025 | $22,195 | $1,312,450 | -- | -- |
| 2024 | $21,216 | $1,274,230 | -- | -- |
| 2023 | $20,224 | $1,237,120 | $0 | $0 |
| 2022 | $18,006 | $1,166,110 | $0 | $0 |
| 2021 | $18,002 | $1,132,150 | $0 | $0 |
| 2020 | $17,131 | $1,132,150 | $0 | $0 |
| 2019 | $16,164 | $1,099,180 | $0 | $0 |
| 2018 | $15,939 | $1,067,170 | $0 | $0 |
| 2017 | $15,583 | $1,036,090 | $0 | $0 |
| 2016 | $15,400 | $1,005,920 | $0 | $0 |
| 2015 | $14,921 | $976,630 | $0 | $0 |
| 2014 | $11,474 | $786,840 | $0 | $0 |
Source: Public Records
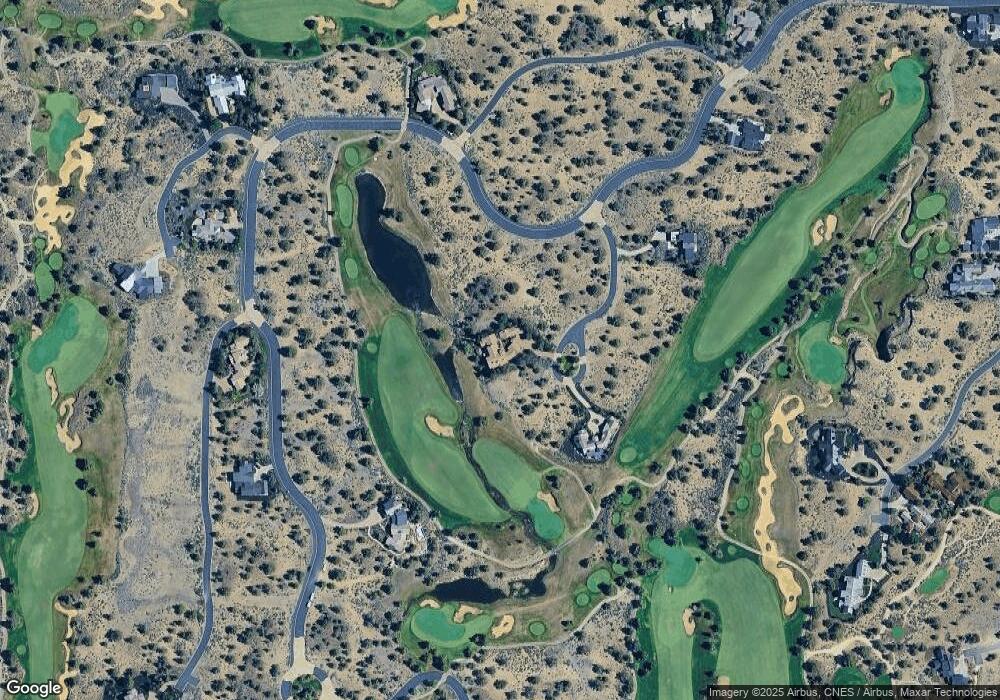
Map
Nearby Homes
- 66315 Pronghorn Estates Dr
- 66325 Pronghorn Estates Dr Unit Lot 211
- 66385 Pronghorn Estates Dr Unit Lot 261
- 66350 Pronghorn Estates Dr
- 65848 Sanctuary Dr Unit 286
- 65877 Sage Canyon Ct Unit 180
- 65827 Sage Canyon Ct Unit 175
- 65867 Sage Canyon Ct Unit F
- 65828 Sanctuary Dr Unit Lot 284
- 65866 Sage Canyon Ct Unit Lot 171
- 65827 Sanctuary Dr Unit 275
- 22933 Canyon View Loop Unit Lot 186
- 65807 Sanctuary Dr Unit Lot 276
- 23020 Brushline Ct Unit Lot 125
- 23011 NW Brushline Ct Unit Lot 122
- 23021 Brushline Ct
- 23031 Brushline Ct Unit 120
- 65777 Sanctuary Dr Unit Lot 279
- 65853 Bearing Dr Unit Lot 132
- 66100 Pronghorn Estates Dr Unit Lot 141
- 65972 Rimrock Ct Unit 195
- 65913 Rimrock Ct
- 65933 Rimrock Ct Unit 205
- 65933 Rimrock Ct
- 66285 Pronghorn Estates Dr Unit 207
- 66285 Pronghorn Estates Dr
- 66305 Pronghorn Estates Dr Unit L-209
- 66305 Pronghorn Estates Dr
- 66305 Pronghorn Estates Dr Unit Lot 209
- 197 Rimrock Ct
- 66305 Pronghorn Estates Unit 209
- 66305 Pronghorn Estates
- 65912 Rimrock Ct
- Lot 206 Rimrock Ct
- 0 Rimrock Ct Unit 201704874
- 0 Rimrock Ct Unit Lot 206 202002616
- 0 Rimrock Ct Unit Lot 206 220120694
- 65953 Rimrock Ct Unit Lot 206