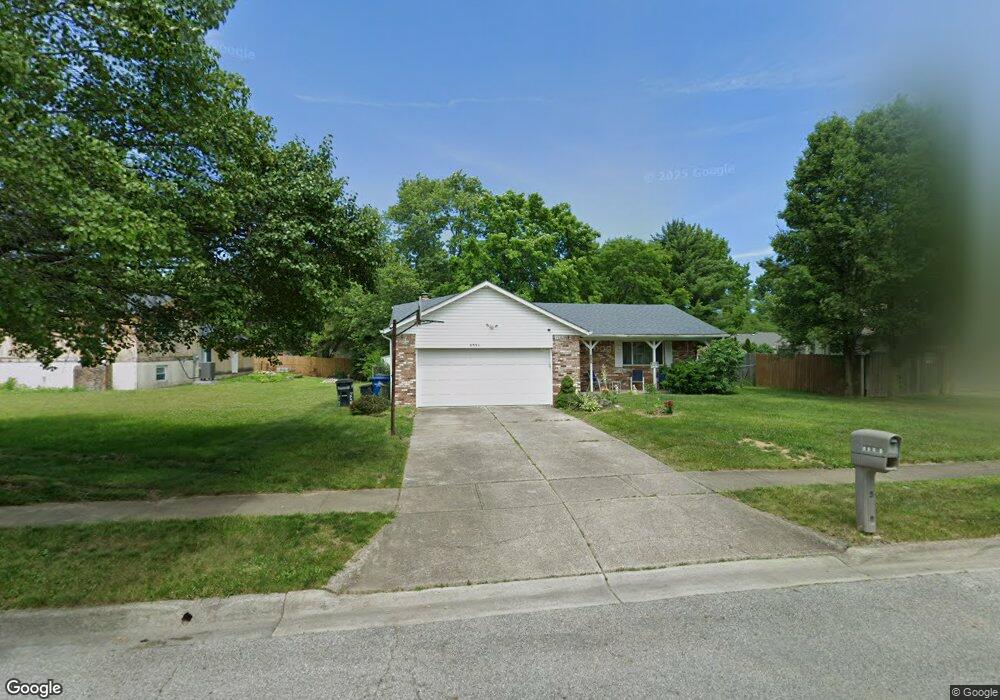
6596 Rosetree Dr Reynoldsburg, OH 43068
Estimated Value: $301,345 - $362,000
3
Beds
3
Baths
1,944
Sq Ft
$170/Sq Ft
Est. Value
About This Home
This home is located at 6596 Rosetree Dr, Reynoldsburg, OH 43068 and is currently estimated at $330,086, approximately $169 per square foot. 6596 Rosetree Dr is a home located in Franklin County with nearby schools including Rose Hill Elementary School, Waggoner Road Junior High School, and Grace Christian School.
Ownership History
Date
Name
Owned For
Owner Type
Purchase Details
Closed on
Jul 27, 2016
Sold by
Martin Wayne A
Bought by
Croston Melinda
Current Estimated Value
Purchase Details
Closed on
May 24, 2007
Sold by
Martin Patricia A
Bought by
Martin Wayne A
Purchase Details
Closed on
Apr 26, 2002
Sold by
Markov Galina
Bought by
Martin Wayne and Martin Patricia A
Home Financials for this Owner
Home Financials are based on the most recent Mortgage that was taken out on this home.
Original Mortgage
$134,183
Interest Rate
7.24%
Mortgage Type
FHA
Purchase Details
Closed on
Dec 2, 1994
Sold by
Sommers Gregory J
Bought by
Pisman Felix and Pisman Markov
Home Financials for this Owner
Home Financials are based on the most recent Mortgage that was taken out on this home.
Original Mortgage
$88,600
Interest Rate
8.91%
Mortgage Type
New Conventional
Purchase Details
Closed on
Oct 16, 1990
Create a Home Valuation Report for This Property
The Home Valuation Report is an in-depth analysis detailing your home's value as well as a comparison with similar homes in the area
Home Values in the Area
Average Home Value in this Area
Purchase History
| Date | Buyer | Sale Price | Title Company |
|---|---|---|---|
| Croston Melinda | -- | None Available | |
| Martin Wayne A | -- | None Available | |
| Martin Wayne | $136,000 | Chicago Title West | |
| Pisman Felix | $110,750 | -- | |
| -- | $90,000 | -- |
Source: Public Records
Mortgage History
| Date | Status | Borrower | Loan Amount |
|---|---|---|---|
| Previous Owner | Martin Wayne | $134,183 | |
| Previous Owner | Pisman Felix | $88,600 |
Source: Public Records
Tax History
| Year | Tax Paid | Tax Assessment Tax Assessment Total Assessment is a certain percentage of the fair market value that is determined by local assessors to be the total taxable value of land and additions on the property. | Land | Improvement |
|---|---|---|---|---|
| 2025 | $4,260 | $83,200 | $25,240 | $57,960 |
| 2024 | $4,260 | $83,200 | $25,240 | $57,960 |
| 2023 | $4,065 | $83,195 | $25,235 | $57,960 |
| 2022 | $3,588 | $55,550 | $12,710 | $42,840 |
| 2021 | $3,602 | $55,550 | $12,710 | $42,840 |
| 2020 | $3,675 | $55,550 | $12,710 | $42,840 |
| 2019 | $3,382 | $46,340 | $10,570 | $35,770 |
| 2018 | $3,384 | $46,340 | $10,570 | $35,770 |
| 2017 | $3,381 | $46,340 | $10,570 | $35,770 |
| 2016 | $3,494 | $42,810 | $9,420 | $33,390 |
| 2015 | $3,386 | $42,810 | $9,420 | $33,390 |
| 2014 | $3,401 | $42,810 | $9,420 | $33,390 |
| 2013 | $1,741 | $45,045 | $9,905 | $35,140 |
Source: Public Records
Map
Nearby Homes
- 445 Hawthorne Place
- 142 Villamere Dr Unit 6
- 145 Shadymere Ln Unit 5
- 491 Durbin Rd Unit A
- 6248 Billington Dr
- 6204 Marias Point Ln
- 524 Woodingham Place Unit 3-B
- 6279 Braiden Ct Unit B
- 6224 McNaughten Place Ln Unit S57
- 86 Stornoway Dr W Unit 86
- 85 Stornoway Dr W Unit 85
- 6828 Frey Ln
- 71 Villa Side Ln
- 6737 Rocky Den Rd
- 7171 Daugherty Dr
- 893 Hunt Valley Dr
- 7082 Wind River Dr
- 6677 Red Coach Ln
- 227 Spinosa St
- 7197 Serenoa Dr
- 6602 Rosetree Dr
- 6592 Rosetree Dr
- 6605 Olivetree Ct
- 6614 Rosetree Dr
- 6611 Olivetree Ct
- 6593 Olivetree Ct
- 6599 Rosetree Dr
- 6597 Rosetree Dr
- 6603 Rosetree Dr
- 6624 Rosetree Dr
- 6595 Rosetree Dr
- 6589 Rosetree Dr
- 6617 Rosetree Dr
- 6587 Rosetree Dr
- 6629 Olivetree Ct
- 6591 Rosetree Dr
- 6632 Rosetree Dr
- 6577 Firethorn Ave
- 6625 Rosetree Dr
- 6593 Rosetree Dr
Your Personal Tour Guide
Ask me questions while you tour the home.