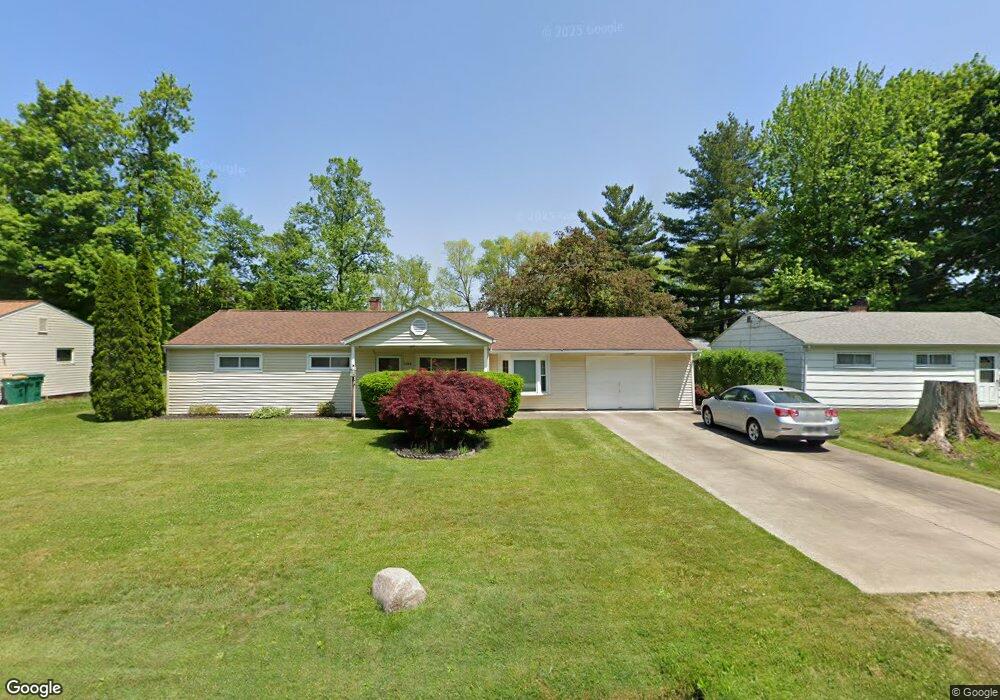
6599 Seneca Trail Mentor, OH 44060
Estimated Value: $156,000 - $199,000
3
Beds
1
Bath
1,074
Sq Ft
$160/Sq Ft
Est. Value
About This Home
This home is located at 6599 Seneca Trail, Mentor, OH 44060 and is currently estimated at $172,116, approximately $160 per square foot. 6599 Seneca Trail is a home located in Lake County with nearby schools including Bellflower Elementary School, Shore Middle School, and Mentor High School.
Ownership History
Date
Name
Owned For
Owner Type
Purchase Details
Closed on
Oct 3, 2002
Sold by
Karaj Mario M
Bought by
Pranjic Ivan and Pranjic Selma
Current Estimated Value
Home Financials for this Owner
Home Financials are based on the most recent Mortgage that was taken out on this home.
Original Mortgage
$104,000
Outstanding Balance
$43,085
Interest Rate
6.39%
Estimated Equity
$129,031
Purchase Details
Closed on
May 6, 2002
Sold by
The Chase Manhattan Bank
Bought by
Karaj Mario M
Home Financials for this Owner
Home Financials are based on the most recent Mortgage that was taken out on this home.
Original Mortgage
$61,600
Interest Rate
6.82%
Purchase Details
Closed on
Mar 27, 2002
Sold by
Iacano Frank A
Bought by
The Chase Manhattan Bank
Home Financials for this Owner
Home Financials are based on the most recent Mortgage that was taken out on this home.
Original Mortgage
$61,600
Interest Rate
6.82%
Purchase Details
Closed on
Jan 1, 1990
Bought by
Iacano Frank A
Create a Home Valuation Report for This Property
The Home Valuation Report is an in-depth analysis detailing your home's value as well as a comparison with similar homes in the area
Home Values in the Area
Average Home Value in this Area
Purchase History
| Date | Buyer | Sale Price | Title Company |
|---|---|---|---|
| Pranjic Ivan | $109,500 | Real Estate Title | |
| Karaj Mario M | $79,000 | Real Estate Title | |
| The Chase Manhattan Bank | $76,000 | -- | |
| Iacano Frank A | -- | -- |
Source: Public Records
Mortgage History
| Date | Status | Borrower | Loan Amount |
|---|---|---|---|
| Open | Pranjic Ivan | $104,000 | |
| Previous Owner | Karaj Mario M | $61,600 |
Source: Public Records
Tax History
| Year | Tax Paid | Tax Assessment Tax Assessment Total Assessment is a certain percentage of the fair market value that is determined by local assessors to be the total taxable value of land and additions on the property. | Land | Improvement |
|---|---|---|---|---|
| 2025 | -- | $48,780 | $16,060 | $32,720 |
| 2024 | -- | $48,780 | $16,060 | $32,720 |
| 2023 | -- | $37,950 | $13,310 | $24,640 |
| 2022 | $1,748 | $37,950 | $13,310 | $24,640 |
| 2021 | $1,753 | $37,950 | $13,310 | $24,640 |
| 2020 | $1,666 | $31,620 | $11,090 | $20,530 |
| 2019 | $1,668 | $31,620 | $11,090 | $20,530 |
| 2018 | $1,492 | $23,920 | $6,990 | $16,930 |
| 2017 | $1,322 | $23,920 | $6,990 | $16,930 |
| 2016 | $1,314 | $23,920 | $6,990 | $16,930 |
| 2015 | $1,198 | $23,920 | $6,990 | $16,930 |
| 2014 | $1,138 | $22,380 | $6,990 | $15,390 |
| 2013 | $1,139 | $22,380 | $6,990 | $15,390 |
Source: Public Records
Map
Nearby Homes
- 1139 Cherokee Trail
- 1171 Garden Rd
- 6436 Seneca Trail
- 6398 Iroquois Trail
- 38606 Granite Dr Unit 28
- 6263 Seneca Trail
- 7127 Lake Shore Blvd
- 1053 Peach Blvd
- 6284 Seneca Rd
- 6271 Firwood Rd
- 766 Cherokee Trail
- 7403 N Chestnut Commons Dr Unit 7J
- 7391 Willow Run Dr
- 7415 N Chestnut Commons Dr
- 38450 Crossbrook Ave
- VL#2 Oak St
- VL#1 Oak St
- 1040 Windermere Dr
- 7506 Jeremy Ave
- 6147 Iroquois Trail
- 6591 Seneca Trail
- 6605 Seneca Trail
- 6598 Seneca Trail
- 6604 Seneca Trail
- 6613 Seneca Trail
- 6592 Seneca Trail
- 6583 Seneca Trail
- 6612 Seneca Trail
- 6619 Seneca Trail
- 6584 Seneca Trail
- 6575 Seneca Trail
- 6597 Seminole Trail
- 6603 Seminole Trail
- 6595 Seminole Trail
- 6620 Seneca Trail
- 6625 Seneca Trail
- 6581 Seminole Trail
- 6611 Seminole Trail
- 6626 Seneca Trail
- 6576 Seneca Trail
Your Personal Tour Guide
Ask me questions while you tour the home.