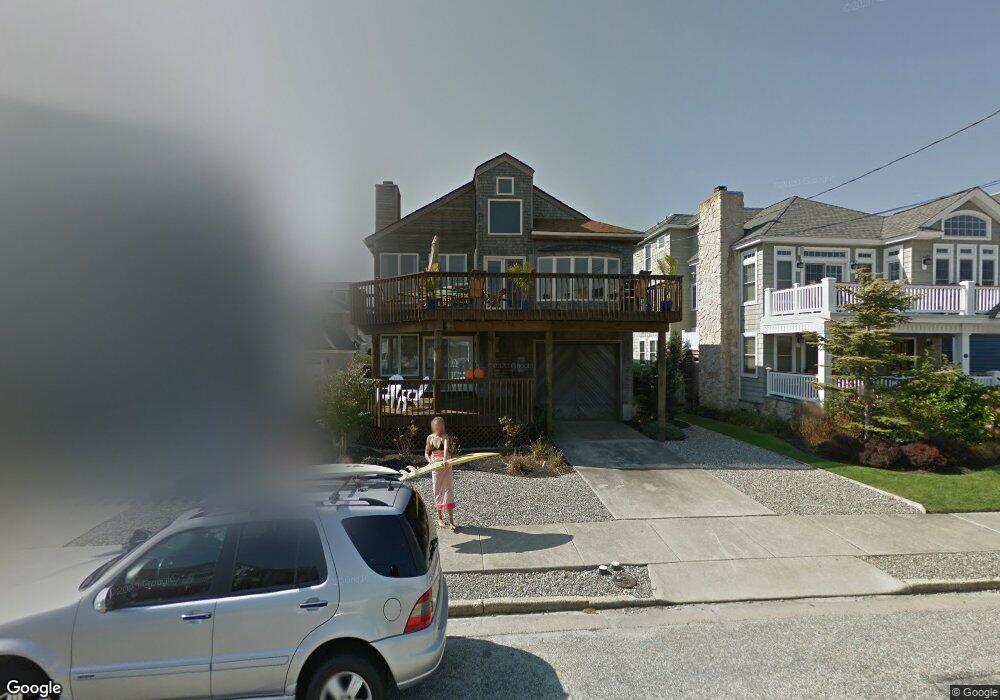
66 11th St E Avalon, NJ 08202
Estimated Value: $3,809,000 - $5,808,000
Studio
--
Bath
2,772
Sq Ft
$1,746/Sq Ft
Est. Value
About This Home
This home is located at 66 11th St E, Avalon, NJ 08202 and is currently estimated at $4,841,089, approximately $1,746 per square foot. 66 11th St E is a home located in Cape May County with nearby schools including Avalon Elementary School.
Ownership History
Date
Name
Owned For
Owner Type
Purchase Details
Closed on
Oct 30, 2017
Sold by
Nicoletti Mary Frances and Hutchinson William A
Bought by
Harper Thomas M and Harper Mary J
Current Estimated Value
Purchase Details
Closed on
Jul 23, 1989
Sold by
Scanlan John and Scanlan Monica
Bought by
Hutchinson William and Hutchinson Helen
Purchase Details
Closed on
Jul 22, 1989
Bought by
Hutchinson William and Hutchinson Helen
Create a Home Valuation Report for This Property
The Home Valuation Report is an in-depth analysis detailing your home's value as well as a comparison with similar homes in the area
Home Values in the Area
Average Home Value in this Area
Purchase History
| Date | Buyer | Sale Price | Title Company |
|---|---|---|---|
| Harper Thomas M | $2,225,000 | Seaboard Title Agency | |
| Hutchinson William | $575,000 | -- | |
| Hutchinson William | $575,000 | -- |
Source: Public Records
Tax History
| Year | Tax Paid | Tax Assessment Tax Assessment Total Assessment is a certain percentage of the fair market value that is determined by local assessors to be the total taxable value of land and additions on the property. | Land | Improvement |
|---|---|---|---|---|
| 2025 | $12,280 | $3,349,500 | $2,000,000 | $1,349,500 |
| 2024 | $12,280 | $2,000,000 | $2,000,000 | $0 |
| 2023 | $14,097 | $2,314,800 | $2,000,000 | $314,800 |
| 2022 | $13,148 | $2,314,800 | $2,000,000 | $314,800 |
| 2021 | $12,662 | $2,314,800 | $2,000,000 | $314,800 |
| 2020 | $12,176 | $2,314,800 | $2,000,000 | $314,800 |
| 2019 | $11,805 | $2,314,800 | $2,000,000 | $314,800 |
| 2018 | $11,296 | $2,314,800 | $2,000,000 | $314,800 |
| 2017 | $11,056 | $1,988,500 | $1,600,000 | $388,500 |
| 2016 | $10,937 | $1,988,500 | $1,600,000 | $388,500 |
| 2015 | $10,758 | $1,988,500 | $1,600,000 | $388,500 |
| 2014 | $10,638 | $1,988,500 | $1,600,000 | $388,500 |
Source: Public Records
Map
Nearby Homes
Your Personal Tour Guide
Ask me questions while you tour the home.