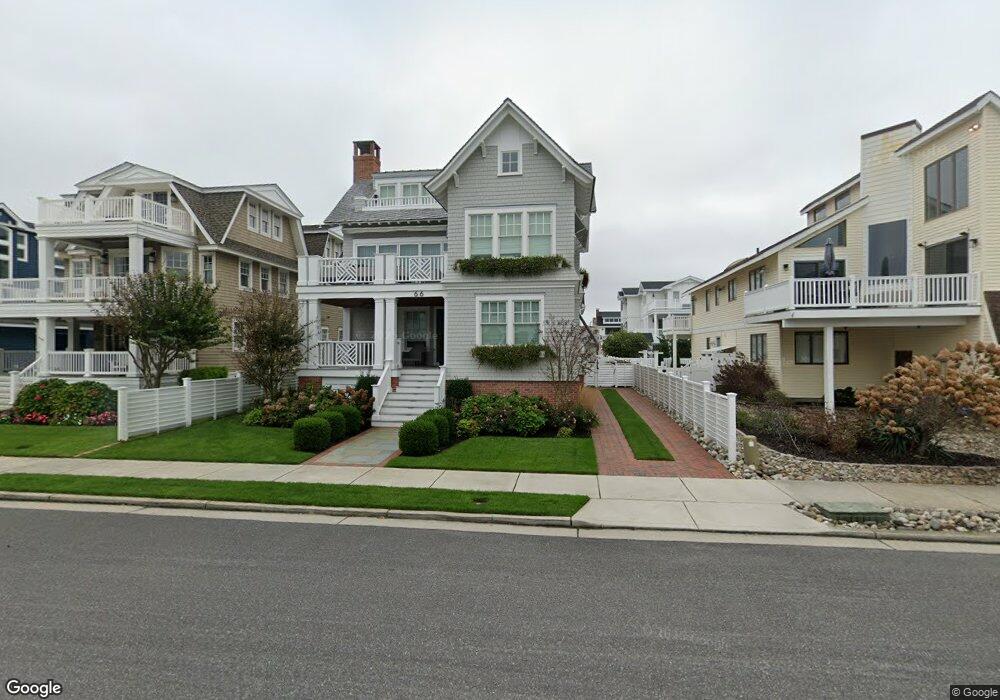
66 15th St E Avalon, NJ 08202
Estimated Value: $4,352,000 - $5,696,711
Studio
--
Bath
3,644
Sq Ft
$1,430/Sq Ft
Est. Value
About This Home
This home is located at 66 15th St E, Avalon, NJ 08202 and is currently estimated at $5,209,928, approximately $1,429 per square foot. 66 15th St E is a home located in Cape May County with nearby schools including Avalon Elementary School.
Ownership History
Date
Name
Owned For
Owner Type
Purchase Details
Closed on
Oct 2, 2013
Sold by
Glomb Frances M
Bought by
Kelly Gregory P and Kelly Denise M
Current Estimated Value
Home Financials for this Owner
Home Financials are based on the most recent Mortgage that was taken out on this home.
Original Mortgage
$1,470,000
Outstanding Balance
$1,108,015
Interest Rate
4.58%
Mortgage Type
New Conventional
Estimated Equity
$4,101,913
Purchase Details
Closed on
May 21, 2007
Sold by
Pollard John L and Pollard Maureen D
Bought by
Glomb Frances M
Home Financials for this Owner
Home Financials are based on the most recent Mortgage that was taken out on this home.
Original Mortgage
$1,100,000
Interest Rate
5.91%
Mortgage Type
Purchase Money Mortgage
Purchase Details
Closed on
Jul 29, 2004
Sold by
Rabbitt Edward C and Rabbitt Eileen H
Bought by
Pollard John L and Pollard Maureen D
Purchase Details
Closed on
Feb 24, 1990
Sold by
Totaro Totaro J and Totaro Judith
Bought by
Rabbitt Edward and Rabbitt Eileen
Create a Home Valuation Report for This Property
The Home Valuation Report is an in-depth analysis detailing your home's value as well as a comparison with similar homes in the area
Home Values in the Area
Average Home Value in this Area
Purchase History
| Date | Buyer | Sale Price | Title Company |
|---|---|---|---|
| Kelly Gregory P | $2,100,000 | Seaboard Title Agency | |
| Glomb Frances M | $2,495,000 | None Available | |
| Pollard John L | $1,600,000 | Seaboard Title Agency | |
| Rabbitt Edward | $450,000 | -- |
Source: Public Records
Mortgage History
| Date | Status | Borrower | Loan Amount |
|---|---|---|---|
| Open | Kelly Gregory P | $1,470,000 | |
| Previous Owner | Glomb Frances M | $1,100,000 |
Source: Public Records
Tax History
| Year | Tax Paid | Tax Assessment Tax Assessment Total Assessment is a certain percentage of the fair market value that is determined by local assessors to be the total taxable value of land and additions on the property. | Land | Improvement |
|---|---|---|---|---|
| 2025 | $19,211 | $3,128,800 | $2,000,000 | $1,128,800 |
| 2024 | $19,211 | $3,128,800 | $2,000,000 | $1,128,800 |
| 2023 | $19,054 | $3,128,800 | $2,000,000 | $1,128,800 |
| 2022 | $17,772 | $3,128,800 | $2,000,000 | $1,128,800 |
| 2021 | $17,029 | $3,128,800 | $2,000,000 | $1,128,800 |
| 2020 | $16,457 | $3,128,800 | $2,000,000 | $1,128,800 |
| 2019 | $15,957 | $3,128,800 | $2,000,000 | $1,128,800 |
| 2018 | $15,269 | $3,128,800 | $2,000,000 | $1,128,800 |
| 2017 | $8,896 | $1,600,000 | $1,600,000 | $0 |
| 2016 | $10,612 | $1,929,400 | $1,600,000 | $329,400 |
| 2015 | $10,438 | $1,929,400 | $1,600,000 | $329,400 |
| 2014 | $10,322 | $1,908,400 | $1,600,000 | $308,400 |
Source: Public Records
Map
Nearby Homes
Your Personal Tour Guide
Ask me questions while you tour the home.