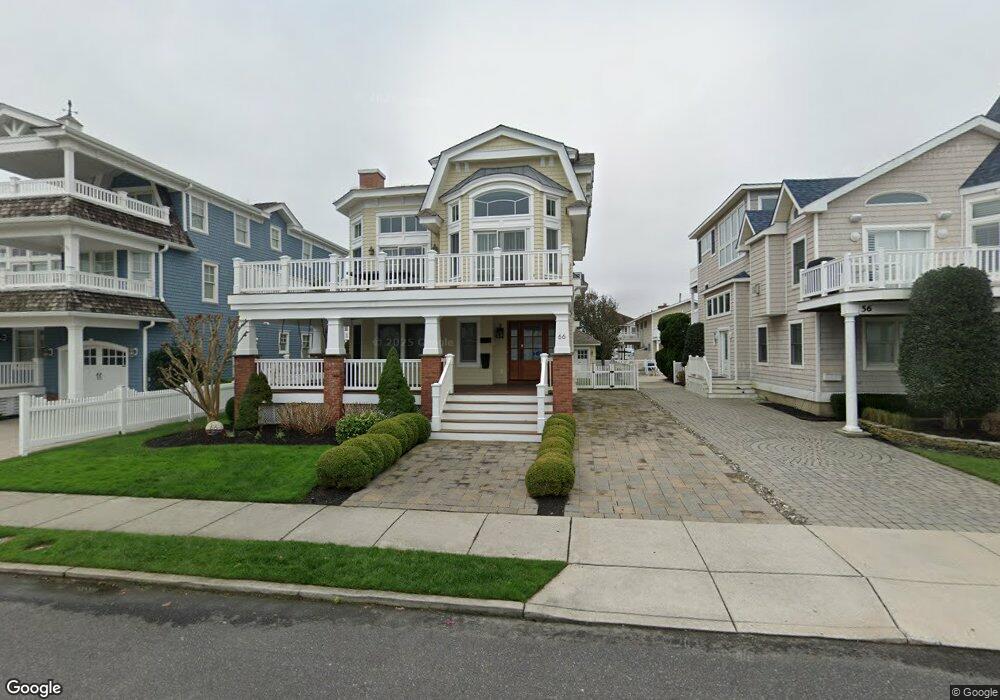
66 18th St E Avalon, NJ 08202
Estimated Value: $4,778,000 - $5,523,000
Studio
--
Bath
3,445
Sq Ft
$1,515/Sq Ft
Est. Value
About This Home
This home is located at 66 18th St E, Avalon, NJ 08202 and is currently estimated at $5,219,252, approximately $1,515 per square foot. 66 18th St E is a home located in Cape May County with nearby schools including Avalon Elementary School.
Ownership History
Date
Name
Owned For
Owner Type
Purchase Details
Closed on
Feb 28, 2011
Sold by
Marino Anthony T
Bought by
Kelleher Andrew J and Kelleher Sharon
Current Estimated Value
Purchase Details
Closed on
Sep 9, 2008
Sold by
Borough Of Avalon
Bought by
Toner Cary and Toner Maryann
Purchase Details
Closed on
Sep 14, 2007
Sold by
Toner Cary and Toner Maryann
Bought by
Marino Anthony T
Home Financials for this Owner
Home Financials are based on the most recent Mortgage that was taken out on this home.
Original Mortgage
$2,540,000
Interest Rate
6.63%
Mortgage Type
Purchase Money Mortgage
Purchase Details
Closed on
Nov 4, 2005
Sold by
66 Sandcastle Llc
Bought by
Toner Cary and Toner Maryann
Purchase Details
Closed on
Jul 29, 2004
Sold by
Bond Joseph M and Bond Regina K
Bought by
66 Sandcastle Llc
Create a Home Valuation Report for This Property
The Home Valuation Report is an in-depth analysis detailing your home's value as well as a comparison with similar homes in the area
Home Values in the Area
Average Home Value in this Area
Purchase History
| Date | Buyer | Sale Price | Title Company |
|---|---|---|---|
| Kelleher Andrew J | $2,200,000 | None Available | |
| Toner Cary | -- | None Available | |
| Marino Anthony T | $2,200,000 | None Available | |
| Toner Cary | -- | -- | |
| 66 Sandcastle Llc | $1,950,000 | Seaboard Title Agency |
Source: Public Records
Mortgage History
| Date | Status | Borrower | Loan Amount |
|---|---|---|---|
| Previous Owner | Marino Anthony T | $2,540,000 |
Source: Public Records
Tax History
| Year | Tax Paid | Tax Assessment Tax Assessment Total Assessment is a certain percentage of the fair market value that is determined by local assessors to be the total taxable value of land and additions on the property. | Land | Improvement |
|---|---|---|---|---|
| 2025 | $18,486 | $3,010,800 | $2,000,000 | $1,010,800 |
| 2024 | $18,486 | $3,010,800 | $2,000,000 | $1,010,800 |
| 2023 | $18,336 | $3,010,800 | $2,000,000 | $1,010,800 |
| 2022 | $17,101 | $3,010,800 | $2,000,000 | $1,010,800 |
| 2021 | $12,510 | $3,010,800 | $2,000,000 | $1,010,800 |
| 2020 | $15,837 | $3,010,800 | $2,000,000 | $1,010,800 |
| 2019 | $15,355 | $3,010,800 | $2,000,000 | $1,010,800 |
| 2018 | $14,693 | $3,010,800 | $2,000,000 | $1,010,800 |
| 2017 | $13,943 | $2,507,800 | $1,600,000 | $907,800 |
| 2016 | $13,793 | $2,507,800 | $1,600,000 | $907,800 |
| 2015 | $13,567 | $2,507,800 | $1,600,000 | $907,800 |
| 2014 | $13,417 | $2,507,800 | $1,600,000 | $907,800 |
Source: Public Records
Map
Nearby Homes
Your Personal Tour Guide
Ask me questions while you tour the home.