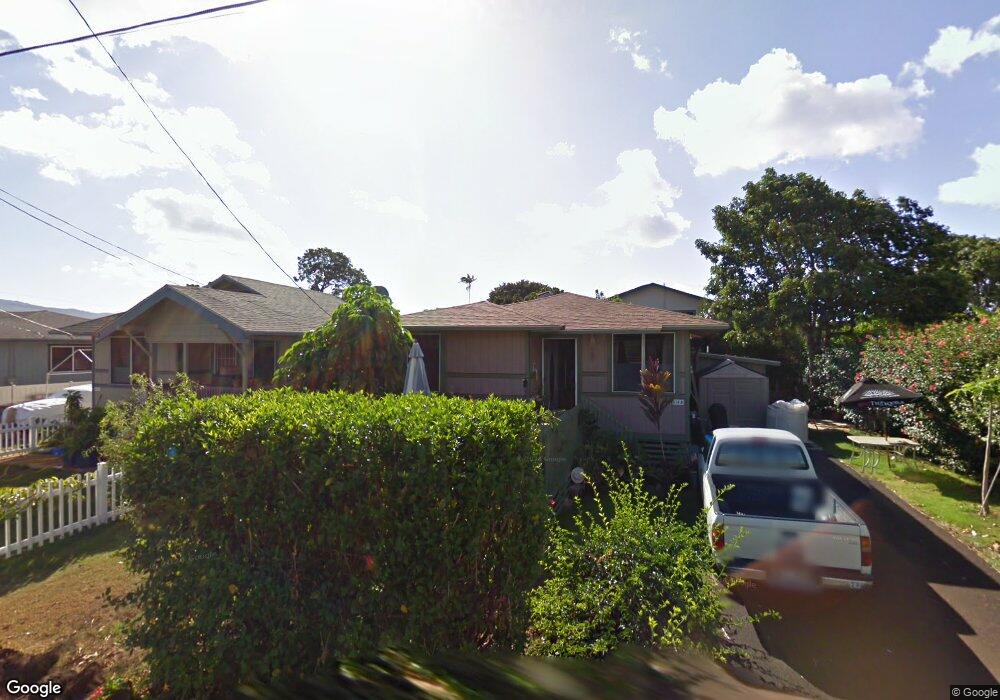
66-345 Kaamooloa Rd Unit H Waialua, HI 96791
Estimated Value: $1,003,000 - $1,300,000
4
Beds
2
Baths
1,344
Sq Ft
$854/Sq Ft
Est. Value
About This Home
This home is located at 66-345 Kaamooloa Rd Unit H, Waialua, HI 96791 and is currently estimated at $1,147,368, approximately $853 per square foot. 66-345 Kaamooloa Rd Unit H is a home located in Honolulu County with nearby schools including Haleiwa Elementary School and Waialua High & Intermediate School.
Ownership History
Date
Name
Owned For
Owner Type
Purchase Details
Closed on
May 26, 2011
Sold by
Aquila Ashlen Nolen and Aquila Ivy Marie
Bought by
Fernandez Adam Joseph and Fernandez Jessica Sonia
Current Estimated Value
Home Financials for this Owner
Home Financials are based on the most recent Mortgage that was taken out on this home.
Original Mortgage
$553,367
Outstanding Balance
$383,266
Interest Rate
4.73%
Mortgage Type
New Conventional
Estimated Equity
$764,103
Purchase Details
Closed on
Mar 23, 2006
Sold by
Pacific Rim Development Group Llc
Bought by
Nolen Ashlen Aquila and Dewilde Ivy Marie
Home Financials for this Owner
Home Financials are based on the most recent Mortgage that was taken out on this home.
Original Mortgage
$444,000
Interest Rate
7.25%
Mortgage Type
Fannie Mae Freddie Mac
Create a Home Valuation Report for This Property
The Home Valuation Report is an in-depth analysis detailing your home's value as well as a comparison with similar homes in the area
Home Values in the Area
Average Home Value in this Area
Purchase History
| Date | Buyer | Sale Price | Title Company |
|---|---|---|---|
| Fernandez Adam Joseph | $534,000 | Old Republic | |
| Nolen Ashlen Aquila | $555,000 | First American Title Co Inc |
Source: Public Records
Mortgage History
| Date | Status | Borrower | Loan Amount |
|---|---|---|---|
| Open | Fernandez Adam Joseph | $553,367 | |
| Previous Owner | Nolen Ashlen Aquila | $444,000 |
Source: Public Records
Tax History Compared to Growth
Tax History
| Year | Tax Paid | Tax Assessment Tax Assessment Total Assessment is a certain percentage of the fair market value that is determined by local assessors to be the total taxable value of land and additions on the property. | Land | Improvement |
|---|---|---|---|---|
| 2025 | $3,350 | $944,600 | $618,000 | $326,600 |
| 2024 | $3,350 | $957,000 | $618,000 | $339,000 |
| 2023 | $3,234 | $924,100 | $646,600 | $277,500 |
| 2022 | $2,955 | $844,300 | $475,400 | $368,900 |
| 2021 | $2,571 | $734,600 | $451,700 | $282,900 |
| 2020 | $2,654 | $758,400 | $418,400 | $340,000 |
| 2019 | $2,620 | $748,600 | $437,400 | $311,200 |
| 2018 | $2,319 | $662,500 | $389,900 | $272,600 |
| 2017 | $2,172 | $620,500 | $351,800 | $268,700 |
| 2016 | $2,052 | $586,400 | $318,600 | $267,800 |
| 2015 | $1,925 | $549,900 | $285,600 | $264,300 |
| 2014 | $1,312 | $516,600 | $276,100 | $240,500 |
Source: Public Records
Map
Nearby Homes
- 66-925 Ulihi Place
- 66-924 Kiekonea Way
- 66-912 Kamakahala St Unit 2
- 66-346 Paalaa Rd
- 67-427 Kekauwa St
- 67-446 Kioe St
- 67-401 Aikaula St
- 65-283 Kaukonahua Rd Unit 26
- 65-283 Kaukonahua Rd Unit 22
- 65-283 Kaukonahua Rd Unit 8
- 65-283 Kaukonahua Rd Unit 6
- 65-283 Kaukonahua Rd Unit 23
- 65-283 Kaukonahua Rd Unit 28
- 65-283 Kaukonahua Rd Unit 4
- 65-283 Kaukonahua Rd Unit 21
- 65-283 Kaukonahua Rd Unit 7
- 65-283 Kaukonahua Rd Unit 27
- 65-283 Kaukonahua Rd Unit 29
- 65-283 Kaukonahua Rd Unit 2
- 65-283 Kaukonahua Rd Unit 5
- 66-345 Kaamooloa Rd Unit C
- 66-345 Kaamooloa Rd Unit B
- 66-345 Kaamooloa Rd Unit D
- 66-345 Kaamooloa Rd Unit F
- 66-345 Kaamooloa Rd Unit G
- 66-345 Kaamooloa Rd Unit A
- 66-345 Kaamooloa Rd Unit E
- 66-345 Kaamooloa Rd Unit 66-345A
- 66-341 Kaamooloa Rd Unit A
- 66-341 Kaamooloa Rd Unit B
- 66-341 Kaamooloa Rd Unit C
- 66-341 Kaamooloa Rd Unit F
- 66-341 Kaamooloa Rd Unit G
- 66-341 Kaamooloa Rd Unit E
- 66-341 Kaamooloa Rd Unit D
- 66-912 Lupenui Place
- 66-909 Pawehe Place
- 66-906 Lupenui Place
- 66-926 Lupenui Place
- 66341 Kaamooloa Rd Unit G