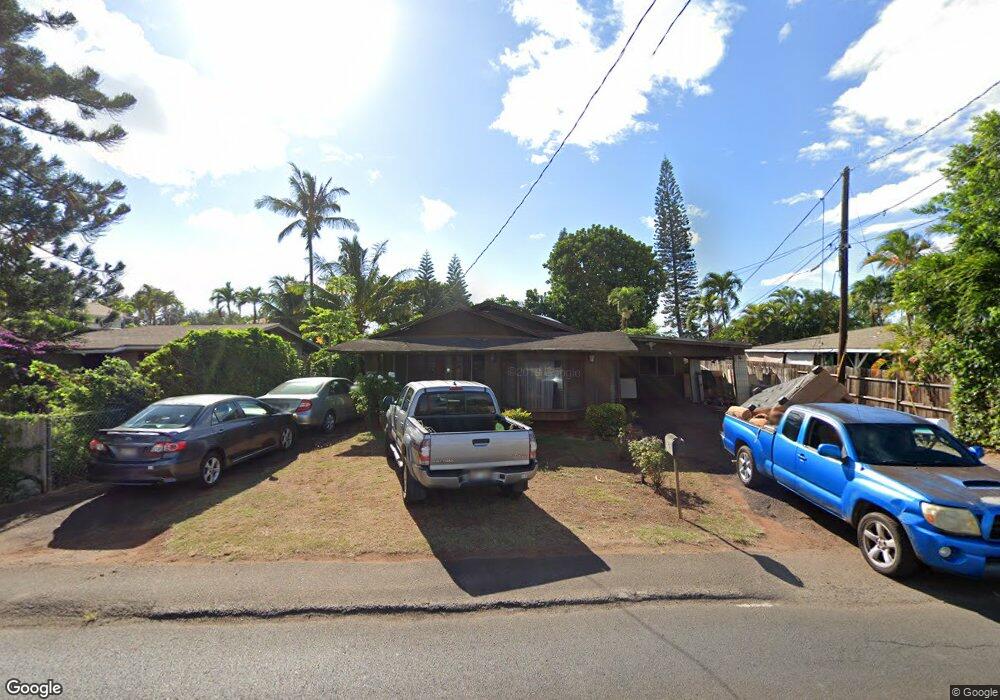
66-377 Haleiwa Rd Unit A Haleiwa, HI 96712
Estimated Value: $947,813 - $1,184,000
3
Beds
1
Bath
928
Sq Ft
$1,177/Sq Ft
Est. Value
About This Home
This home is located at 66-377 Haleiwa Rd Unit A, Haleiwa, HI 96712 and is currently estimated at $1,091,953, approximately $1,176 per square foot. 66-377 Haleiwa Rd Unit A is a home located in Honolulu County with nearby schools including Haleiwa Elementary School and Waialua High & Intermediate School.
Ownership History
Date
Name
Owned For
Owner Type
Purchase Details
Closed on
Jan 22, 2014
Sold by
Gillette Britton Craig and Britton Elizabeth Ann
Bought by
Revocable Trust Of Craig G Britton & Eli
Current Estimated Value
Purchase Details
Closed on
May 12, 2005
Sold by
Gillette Britton Craig and Marineau Elizabeth Ann
Bought by
Gillette Britton Craig and Britton Elizabeth Ann
Home Financials for this Owner
Home Financials are based on the most recent Mortgage that was taken out on this home.
Original Mortgage
$22,300
Interest Rate
6.21%
Mortgage Type
Stand Alone Refi Refinance Of Original Loan
Create a Home Valuation Report for This Property
The Home Valuation Report is an in-depth analysis detailing your home's value as well as a comparison with similar homes in the area
Home Values in the Area
Average Home Value in this Area
Purchase History
| Date | Buyer | Sale Price | Title Company |
|---|---|---|---|
| Revocable Trust Of Craig G Britton & Eli | -- | None Available | |
| Gillette Britton Craig | -- | None Available | |
| Revocable Trust Of Craig G Britton & Eli | -- | None Available | |
| Gillette Britton Craig | -- | None Available | |
| Gillette Britton Craig | -- | First American Title Insuran |
Source: Public Records
Mortgage History
| Date | Status | Borrower | Loan Amount |
|---|---|---|---|
| Previous Owner | Gillette Britton Craig | $22,300 |
Source: Public Records
Tax History Compared to Growth
Tax History
| Year | Tax Paid | Tax Assessment Tax Assessment Total Assessment is a certain percentage of the fair market value that is determined by local assessors to be the total taxable value of land and additions on the property. | Land | Improvement |
|---|---|---|---|---|
| 2025 | $3,350 | $1,056,700 | $900,000 | $156,700 |
| 2024 | $3,350 | $957,000 | $850,000 | $107,000 |
| 2023 | $4,011 | $1,001,000 | $850,000 | $151,000 |
| 2022 | $3,054 | $872,500 | $680,000 | $192,500 |
| 2021 | $2,783 | $795,100 | $630,000 | $165,100 |
| 2020 | $2,627 | $750,500 | $590,000 | $160,500 |
| 2019 | $2,709 | $774,000 | $620,000 | $154,000 |
| 2018 | $2,409 | $688,200 | $560,000 | $128,200 |
| 2017 | $2,209 | $631,000 | $475,000 | $156,000 |
| 2016 | $2,228 | $636,700 | $410,000 | $226,700 |
| 2015 | $1,796 | $513,200 | $410,000 | $103,200 |
| 2014 | -- | $468,300 | $380,000 | $88,300 |
Source: Public Records
Map
Nearby Homes
- 66-083 Alapii St
- 66-303 Haleiwa Rd Unit A306
- 66-158A Haleiwa Rd
- 66-158 Haleiwa Rd
- 66-815 Kamehameha Hwy
- 66-465 Kilioe Place
- 66-490 Kilioe Place
- 66-346 Paalaa Rd
- 62-106 Emerson Rd
- 67-4 Kahaone Place Unit A
- 62-117 Lokoea Place Unit 2
- 66-912 Kamakahala St Unit 2
- 67-003 Kahaone Place
- 67-241 Kahaone Loop
- 67-259 Kahaone Loop
- 67-203 Kukea Cir
- 67-267 Kahaone Loop Unit 2
- 66-925 Ulihi Place
- 66-924 Kiekonea Way
- 67-401 Aikaula St
- 66-377 Haleiwa Rd
- 66-377 Haleiwa Rd Unit B
- 66-369 Haleiwa Rd
- 66-381 Haleiwa Rd
- 66-365 Haleiwa Rd
- 66-387 Haleiwa Rd
- 66-372 Haleiwa Rd
- 66-386 Haleiwa Rd
- 66-386 Haleiwa Rd
- 66-386 Haleiwa Rd Unit K
- 66-386 Haleiwa Rd Unit B
- 66-386 Haleiwa Rd Unit 2
- 66-386 Haleiwa Rd Unit F
- 66-386 Haleiwa Rd Unit I
- 66-386 Haleiwa Rd Unit J
- 66-386 Haleiwa Rd Unit A
- 66-386 Haleiwa Rd Unit M
- 66-386 Haleiwa Rd Unit 5
- 66-386 Haleiwa Rd Unit 3
- 66-386 Haleiwa Rd Unit 1