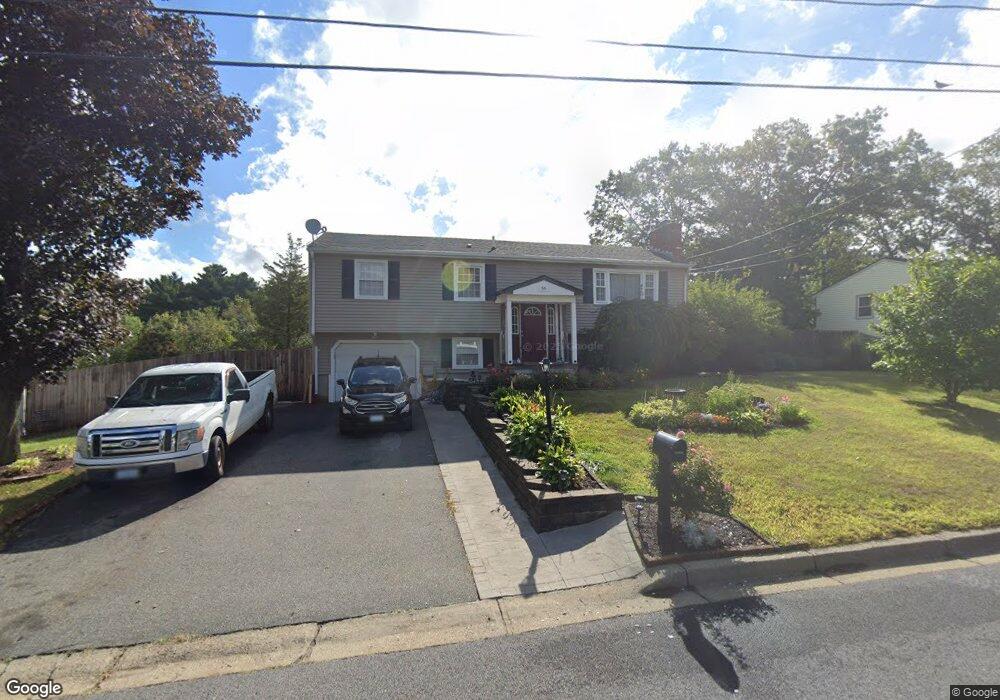
66 Acorn Ln West Warwick, RI 02893
Crompton NeighborhoodEstimated Value: $439,000 - $491,000
3
Beds
3
Baths
1,118
Sq Ft
$416/Sq Ft
Est. Value
About This Home
This home is located at 66 Acorn Ln, West Warwick, RI 02893 and is currently estimated at $464,817, approximately $415 per square foot. 66 Acorn Ln is a home located in Kent County with nearby schools including West Warwick High School and Father John V. Doyle School.
Ownership History
Date
Name
Owned For
Owner Type
Purchase Details
Closed on
Oct 5, 2006
Sold by
Degraw Russell J and Degraw Tracy E
Bought by
Crone Jeffrey A and Leyden Maureen T
Current Estimated Value
Home Financials for this Owner
Home Financials are based on the most recent Mortgage that was taken out on this home.
Original Mortgage
$275,500
Outstanding Balance
$165,122
Interest Rate
6.54%
Mortgage Type
Purchase Money Mortgage
Estimated Equity
$299,695
Purchase Details
Closed on
Sep 27, 1991
Sold by
Morton Pauline
Bought by
Fascio Robert J
Create a Home Valuation Report for This Property
The Home Valuation Report is an in-depth analysis detailing your home's value as well as a comparison with similar homes in the area
Home Values in the Area
Average Home Value in this Area
Purchase History
| Date | Buyer | Sale Price | Title Company |
|---|---|---|---|
| Crone Jeffrey A | $290,000 | -- | |
| Fascio Robert J | $126,500 | -- |
Source: Public Records
Mortgage History
| Date | Status | Borrower | Loan Amount |
|---|---|---|---|
| Open | Fascio Robert J | $275,500 | |
| Previous Owner | Fascio Robert J | $157,500 | |
| Previous Owner | Fascio Robert J | $159,000 | |
| Previous Owner | Fascio Robert J | $145,000 |
Source: Public Records
Tax History Compared to Growth
Tax History
| Year | Tax Paid | Tax Assessment Tax Assessment Total Assessment is a certain percentage of the fair market value that is determined by local assessors to be the total taxable value of land and additions on the property. | Land | Improvement |
|---|---|---|---|---|
| 2025 | $5,549 | $388,300 | $113,600 | $274,700 |
| 2024 | $5,521 | $295,400 | $89,800 | $205,600 |
| 2023 | $5,412 | $295,400 | $89,800 | $205,600 |
| 2022 | $5,329 | $295,400 | $89,800 | $205,600 |
| 2021 | $5,520 | $240,000 | $71,800 | $168,200 |
| 2020 | $5,520 | $240,000 | $71,800 | $168,200 |
| 2019 | $7,037 | $240,000 | $71,800 | $168,200 |
| 2018 | $5,026 | $184,900 | $69,700 | $115,200 |
| 2017 | $4,865 | $184,900 | $69,700 | $115,200 |
| 2016 | $4,778 | $184,900 | $69,700 | $115,200 |
| 2015 | $4,644 | $178,900 | $69,700 | $109,200 |
| 2014 | $1,093 | $178,900 | $69,700 | $109,200 |
Source: Public Records
Map
Nearby Homes
- 105 Scenic Dr
- 12 Longbow Dr
- 0 New London Turnpike
- 12 Whittier Dr
- 25 Wescott Way Unit 80
- 1 Hampton Rd Unit 27
- 19 Hampton Rd Unit 69
- 32 Wescott Way Unit 53
- 40 Wescott Way Unit 57
- 15 Hampton Rd Unit 20
- 65 Angus St
- 194 Kimberly Ln
- 99 Silverwood Ln
- 10 Minglewood Dr
- 0 James P Murphy Ind Hwy
- 75 Esmond St Unit 1D
- 215 Watch Hill Dr
- 105 Watch Hill
- 125 Setian Ln
- 40 E Greenwich Ave