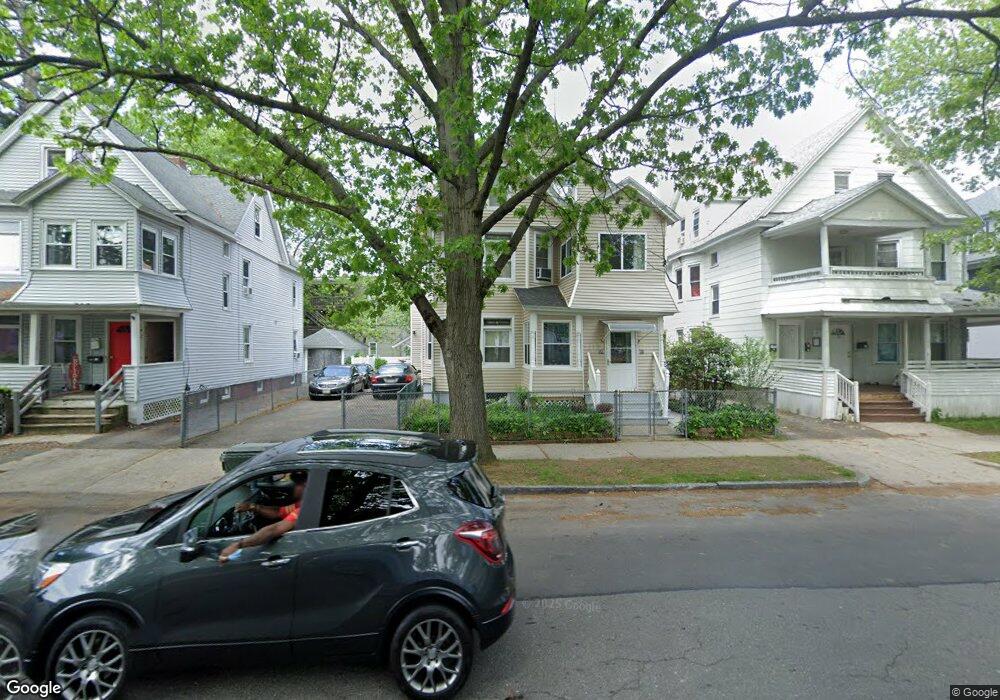
66 Alderman St Unit 68 Springfield, MA 01108
Forest Park NeighborhoodEstimated Value: $262,098 - $363,000
7
Beds
4
Baths
2,821
Sq Ft
$116/Sq Ft
Est. Value
About This Home
This home is located at 66 Alderman St Unit 68, Springfield, MA 01108 and is currently estimated at $328,025, approximately $116 per square foot. 66 Alderman St Unit 68 is a home located in Hampden County with nearby schools including White Street Elementary School, Forest Park Middle School, and High School Of Commerce.
Ownership History
Date
Name
Owned For
Owner Type
Purchase Details
Closed on
May 31, 2006
Sold by
James Derrick and James Collin
Bought by
Wright Cynthia M
Current Estimated Value
Purchase Details
Closed on
Jul 20, 2004
Sold by
Wright Cynthia M
Bought by
James Collin and Wright Cynthia M
Purchase Details
Closed on
Feb 25, 2004
Sold by
James Collin and Wright Cynthia M
Bought by
Wright Cynthia M
Purchase Details
Closed on
Nov 13, 1998
Sold by
Dunn William E and Dunn Louise E
Bought by
Wright Cynthia M
Home Financials for this Owner
Home Financials are based on the most recent Mortgage that was taken out on this home.
Original Mortgage
$71,963
Interest Rate
6.65%
Mortgage Type
Purchase Money Mortgage
Purchase Details
Closed on
Dec 2, 1992
Sold by
Winkler Irene R and Winkler Paul J
Bought by
Winkler Janet I and Dunn Louise E
Create a Home Valuation Report for This Property
The Home Valuation Report is an in-depth analysis detailing your home's value as well as a comparison with similar homes in the area
Home Values in the Area
Average Home Value in this Area
Purchase History
| Date | Buyer | Sale Price | Title Company |
|---|---|---|---|
| Wright Cynthia M | -- | -- | |
| James Collin | -- | -- | |
| Wright Cynthia M | -- | -- | |
| Wright Cynthia M | $71,500 | -- | |
| Winkler Janet I | $80,000 | -- |
Source: Public Records
Mortgage History
| Date | Status | Borrower | Loan Amount |
|---|---|---|---|
| Previous Owner | Winkler Janet I | $25,000 | |
| Previous Owner | Winkler Janet I | $71,963 |
Source: Public Records
Tax History Compared to Growth
Tax History
| Year | Tax Paid | Tax Assessment Tax Assessment Total Assessment is a certain percentage of the fair market value that is determined by local assessors to be the total taxable value of land and additions on the property. | Land | Improvement |
|---|---|---|---|---|
| 2025 | $2,982 | $190,200 | $30,000 | $160,200 |
| 2024 | $2,433 | $151,500 | $30,000 | $121,500 |
| 2023 | $2,508 | $147,100 | $27,300 | $119,800 |
| 2022 | $2,949 | $156,700 | $25,500 | $131,200 |
| 2021 | $2,911 | $154,000 | $23,200 | $130,800 |
| 2020 | $2,945 | $150,800 | $23,200 | $127,600 |
| 2019 | $2,676 | $136,000 | $23,200 | $112,800 |
| 2018 | $2,432 | $123,600 | $23,200 | $100,400 |
| 2017 | $2,347 | $119,400 | $21,800 | $97,600 |
| 2016 | $1,946 | $99,000 | $21,800 | $77,200 |
| 2015 | $1,997 | $101,500 | $21,800 | $79,700 |
Source: Public Records
Map
Nearby Homes
- 93 Wilmont St
- 127-129 Ranney St
- 52 Wilmont St
- 177 Johnson St
- 8 Wilmont St
- 20 Vermont St
- 22-24 Ainsworth St
- 192 White St
- 327 Orange St
- 209 White St
- 52 Herman St
- 292-294 Orange St
- 242-244 Orange St
- 125 Oakland St
- 29 Wareham St
- 106 Malden St
- 427 Orange St
- 298 Oakland St
- 78-80 Shamrock St
- 15-19 Litchfield St
- 66-68 Alderman St
- 62 Alderman St Unit 64
- 62-64 Alderman St
- 70 Alderman St
- 70 Alderman St Unit 2
- 103 Wilmont St
- 99 Wilmont St
- 99 Wilmont St Unit 2
- 99 Wilmont St Unit 1
- 76 Alderman St
- 58 Alderman St
- 87 Wilmont St Unit 89
- 107-109 Wilmont St
- 107 Wilmont St Unit 109
- 52 Alderman St
- 82 Alderman St
- 83 Wilmont St Unit 85
- 83-85 Wilmont St
- 115 Wilmont St
- 46 Alderman St