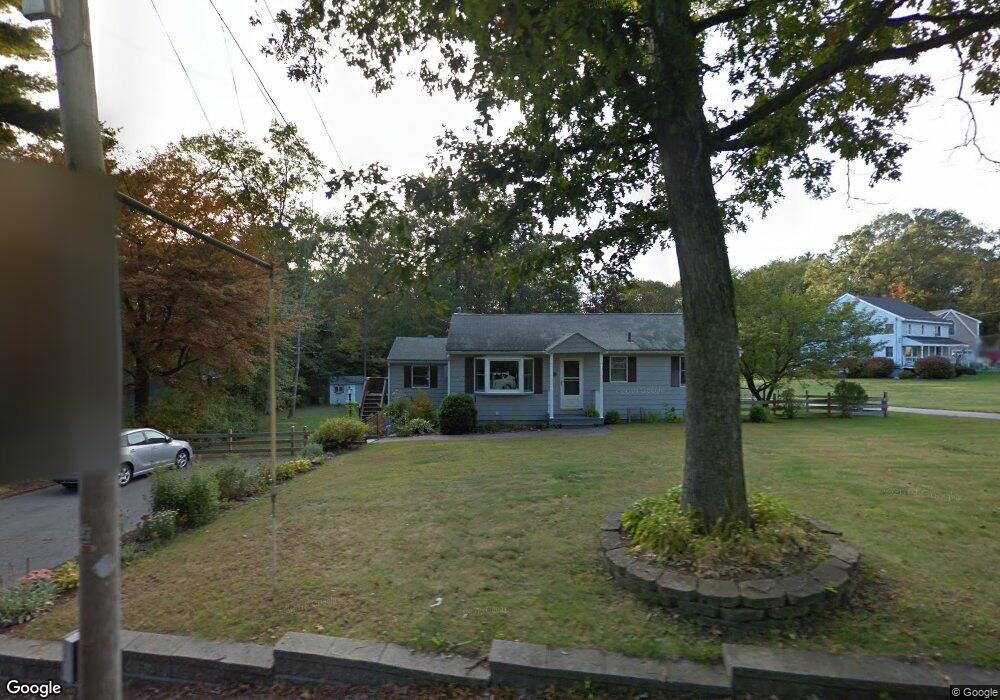
66 Baldwin Rd Billerica, MA 01821
Estimated Value: $673,000 - $868,000
3
Beds
2
Baths
1,600
Sq Ft
$499/Sq Ft
Est. Value
About This Home
This home is located at 66 Baldwin Rd, Billerica, MA 01821 and is currently estimated at $798,193, approximately $498 per square foot. 66 Baldwin Rd is a home located in Middlesex County with nearby schools including Billerica Memorial High School.
Ownership History
Date
Name
Owned For
Owner Type
Purchase Details
Closed on
May 28, 2020
Sold by
Angotti Mario A and Angotti Lauren J
Bought by
Angotti Ft and Angotti
Current Estimated Value
Purchase Details
Closed on
May 11, 2019
Sold by
Angotti Mario A and Angotti Lauren J
Bought by
Belanger Robert R
Purchase Details
Closed on
Jun 30, 2009
Sold by
Wallace Allen and Wallace Jaime
Bought by
Angotti Mario A and Angotti Lauren J
Home Financials for this Owner
Home Financials are based on the most recent Mortgage that was taken out on this home.
Original Mortgage
$312,750
Interest Rate
4.92%
Mortgage Type
Purchase Money Mortgage
Purchase Details
Closed on
May 31, 2005
Sold by
Schultz Janice and Schultz Paul F
Bought by
Wallace Allen and Downing Jaime M
Home Financials for this Owner
Home Financials are based on the most recent Mortgage that was taken out on this home.
Original Mortgage
$287,300
Interest Rate
5.94%
Mortgage Type
Purchase Money Mortgage
Create a Home Valuation Report for This Property
The Home Valuation Report is an in-depth analysis detailing your home's value as well as a comparison with similar homes in the area
Purchase History
| Date | Buyer | Sale Price | Title Company |
|---|---|---|---|
| Angotti Ft | -- | None Available | |
| Belanger Robert R | -- | -- | |
| Angotti Mario A | $347,500 | -- | |
| Wallace Allen | $342,000 | -- |
Source: Public Records
Mortgage History
| Date | Status | Borrower | Loan Amount |
|---|---|---|---|
| Previous Owner | Angotti Mario A | $312,750 | |
| Previous Owner | Wallace Allen | $287,300 |
Source: Public Records
Tax History
| Year | Tax Paid | Tax Assessment Tax Assessment Total Assessment is a certain percentage of the fair market value that is determined by local assessors to be the total taxable value of land and additions on the property. | Land | Improvement |
|---|---|---|---|---|
| 2025 | $8,231 | $723,900 | $337,900 | $386,000 |
| 2024 | $7,593 | $672,500 | $305,700 | $366,800 |
| 2023 | $7,361 | $620,100 | $259,200 | $360,900 |
| 2022 | $6,894 | $545,400 | $238,500 | $306,900 |
| 2021 | $6,699 | $515,300 | $223,400 | $291,900 |
| 2020 | $6,463 | $497,500 | $214,700 | $282,800 |
Source: Public Records
Map
Nearby Homes
- 36 Allen Rd
- 19 Porter St
- 36 Webb Brook Rd Unit 3
- 3 Shawnee Cir
- 3 Memory Ln
- 95 Bellflower Rd
- 15 Primrose Rd
- 11 Edgeworth St
- 25 Wyman Rd
- 30 Wyman Rd
- 20 Kenmar Dr Unit 189
- 10 Kenmar Dr Unit 40
- 6 Glade St
- 133 Salem Rd
- 405 Boston Rd Unit 6
- 369 Andover Rd
- 128 Salem Rd
- 24 Friendship St
- 5 Shawsheen St
- 44 Connolly Rd
Your Personal Tour Guide
Ask me questions while you tour the home.