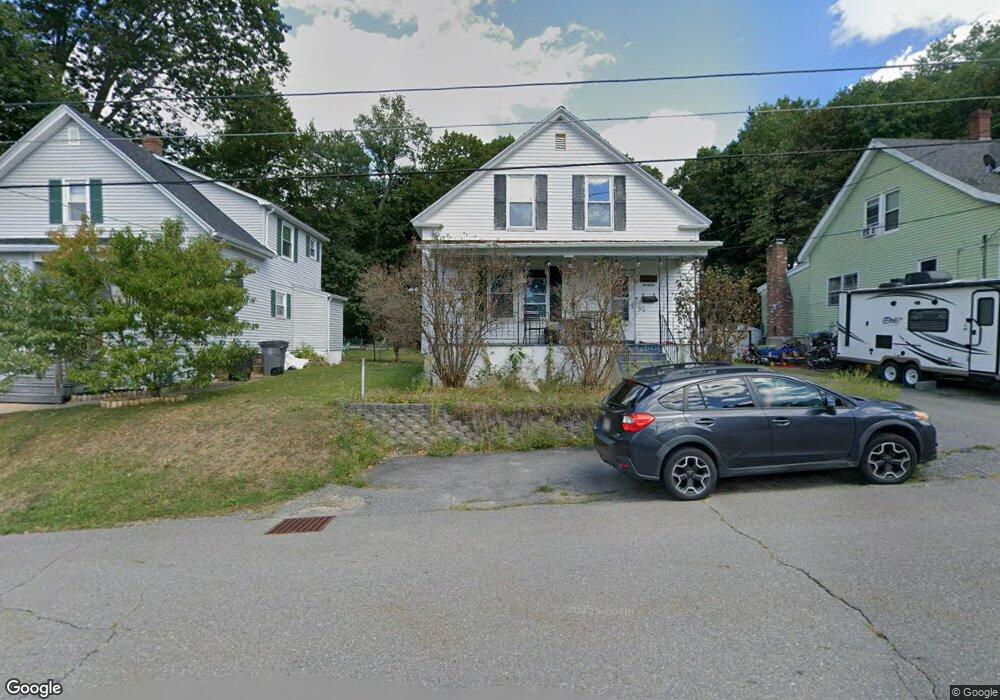
66 Barthel Ave Gardner, MA 01440
Estimated Value: $322,000 - $380,000
4
Beds
2
Baths
1,710
Sq Ft
$205/Sq Ft
Est. Value
About This Home
This home is located at 66 Barthel Ave, Gardner, MA 01440 and is currently estimated at $350,536, approximately $204 per square foot. 66 Barthel Ave is a home located in Worcester County with nearby schools including Gardner High School and Holy Family Academy.
Ownership History
Date
Name
Owned For
Owner Type
Purchase Details
Closed on
Mar 4, 2009
Sold by
Bettez Debra A and Bettez Robert J
Bought by
Bettez Debra A
Current Estimated Value
Home Financials for this Owner
Home Financials are based on the most recent Mortgage that was taken out on this home.
Original Mortgage
$113,000
Outstanding Balance
$71,891
Interest Rate
5.14%
Mortgage Type
Purchase Money Mortgage
Estimated Equity
$278,645
Purchase Details
Closed on
Dec 31, 2001
Sold by
Czestochowskiezinc Tow
Bought by
Bettez Robert J and Bettez Jane M
Create a Home Valuation Report for This Property
The Home Valuation Report is an in-depth analysis detailing your home's value as well as a comparison with similar homes in the area
Home Values in the Area
Average Home Value in this Area
Purchase History
| Date | Buyer | Sale Price | Title Company |
|---|---|---|---|
| Bettez Debra A | -- | -- | |
| Bettez Robert J | $16,000 | -- |
Source: Public Records
Mortgage History
| Date | Status | Borrower | Loan Amount |
|---|---|---|---|
| Open | Bettez Debra A | $113,000 | |
| Previous Owner | Bettez Robert J | $70,000 | |
| Previous Owner | Bettez Robert J | $7,500 | |
| Previous Owner | Bettez Robert J | $77,200 |
Source: Public Records
Tax History
| Year | Tax Paid | Tax Assessment Tax Assessment Total Assessment is a certain percentage of the fair market value that is determined by local assessors to be the total taxable value of land and additions on the property. | Land | Improvement |
|---|---|---|---|---|
| 2025 | $42 | $295,100 | $66,400 | $228,700 |
| 2024 | $4,215 | $281,200 | $60,400 | $220,800 |
| 2023 | $4,142 | $256,800 | $59,500 | $197,300 |
| 2022 | $3,861 | $207,700 | $45,100 | $162,600 |
| 2021 | $3,733 | $186,300 | $39,200 | $147,100 |
| 2020 | $3,601 | $182,400 | $39,200 | $143,200 |
| 2019 | $3,440 | $170,800 | $39,200 | $131,600 |
| 2018 | $3,180 | $156,900 | $39,200 | $117,700 |
| 2017 | $3,240 | $158,200 | $39,200 | $119,000 |
| 2016 | $3,030 | $148,000 | $39,200 | $108,800 |
| 2015 | $2,905 | $145,400 | $39,200 | $106,200 |
| 2014 | $2,800 | $148,400 | $43,500 | $104,900 |
Source: Public Records
Map
Nearby Homes
Your Personal Tour Guide
Ask me questions while you tour the home.