66 Bayberry Dr Somerset, NJ 08873
Estimated Value: $434,396 - $480,000
--
Bed
--
Bath
1,329
Sq Ft
$351/Sq Ft
Est. Value
About This Home
This home is located at 66 Bayberry Dr, Somerset, NJ 08873 and is currently estimated at $467,099, approximately $351 per square foot. 66 Bayberry Dr is a home located in Somerset County with nearby schools including Franklin High School, Thomas Edison EnergySmart Charter School, and Cedar Hill Preparatory School.
Ownership History
Date
Name
Owned For
Owner Type
Purchase Details
Closed on
Jul 24, 2009
Sold by
Yuan Chiang Wei
Bought by
Yuan Alice Chiang Wel
Current Estimated Value
Home Financials for this Owner
Home Financials are based on the most recent Mortgage that was taken out on this home.
Original Mortgage
$100,000
Interest Rate
4.92%
Mortgage Type
Purchase Money Mortgage
Purchase Details
Closed on
May 17, 2002
Sold by
Mcrae Kenneth
Bought by
Yuan Chiang
Home Financials for this Owner
Home Financials are based on the most recent Mortgage that was taken out on this home.
Original Mortgage
$130,000
Interest Rate
7%
Purchase Details
Closed on
May 18, 1998
Sold by
Cheatham Willis
Bought by
Mcrae Kathryn Gray
Home Financials for this Owner
Home Financials are based on the most recent Mortgage that was taken out on this home.
Original Mortgage
$130,000
Interest Rate
7.03%
Mortgage Type
FHA
Create a Home Valuation Report for This Property
The Home Valuation Report is an in-depth analysis detailing your home's value as well as a comparison with similar homes in the area
Home Values in the Area
Average Home Value in this Area
Purchase History
| Date | Buyer | Sale Price | Title Company |
|---|---|---|---|
| Yuan Alice Chiang Wel | -- | New Horizon Title | |
| Yuan Chiang | $210,000 | -- | |
| Mcrae Kathryn Gray | $130,000 | -- |
Source: Public Records
Mortgage History
| Date | Status | Borrower | Loan Amount |
|---|---|---|---|
| Closed | Yuan Alice Chiang Wel | $100,000 | |
| Closed | Yuan Chiang | $130,000 | |
| Previous Owner | Mcrae Kathryn Gray | $130,000 |
Source: Public Records
Tax History Compared to Growth
Tax History
| Year | Tax Paid | Tax Assessment Tax Assessment Total Assessment is a certain percentage of the fair market value that is determined by local assessors to be the total taxable value of land and additions on the property. | Land | Improvement |
|---|---|---|---|---|
| 2025 | $6,399 | $426,800 | $185,000 | $241,800 |
| 2024 | $6,399 | $352,000 | $170,000 | $182,000 |
| 2023 | $6,218 | $322,000 | $140,000 | $182,000 |
| 2022 | $5,747 | $282,000 | $100,000 | $182,000 |
| 2021 | $5,914 | $267,000 | $85,000 | $182,000 |
| 2020 | $5,818 | $257,000 | $75,000 | $182,000 |
| 2019 | $5,916 | $257,000 | $75,000 | $182,000 |
| 2018 | $5,768 | $248,000 | $70,000 | $178,000 |
| 2017 | $5,672 | $243,000 | $65,000 | $178,000 |
| 2016 | $5,595 | $238,000 | $60,000 | $178,000 |
| 2015 | $5,441 | $233,000 | $55,000 | $178,000 |
| 2014 | $5,594 | $243,000 | $65,000 | $178,000 |
Source: Public Records
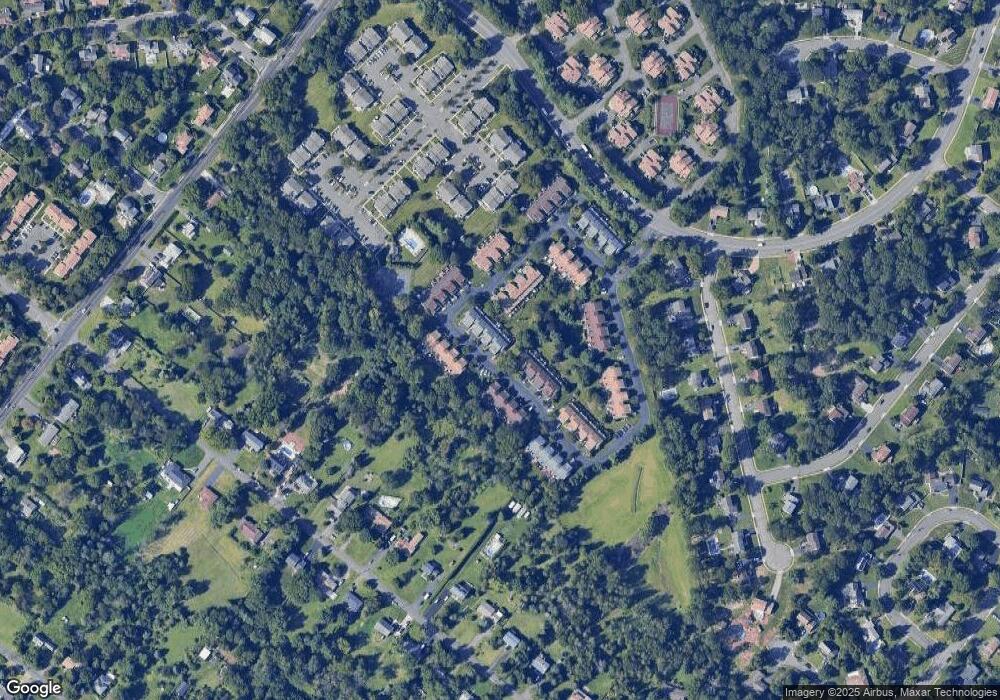
Map
Nearby Homes