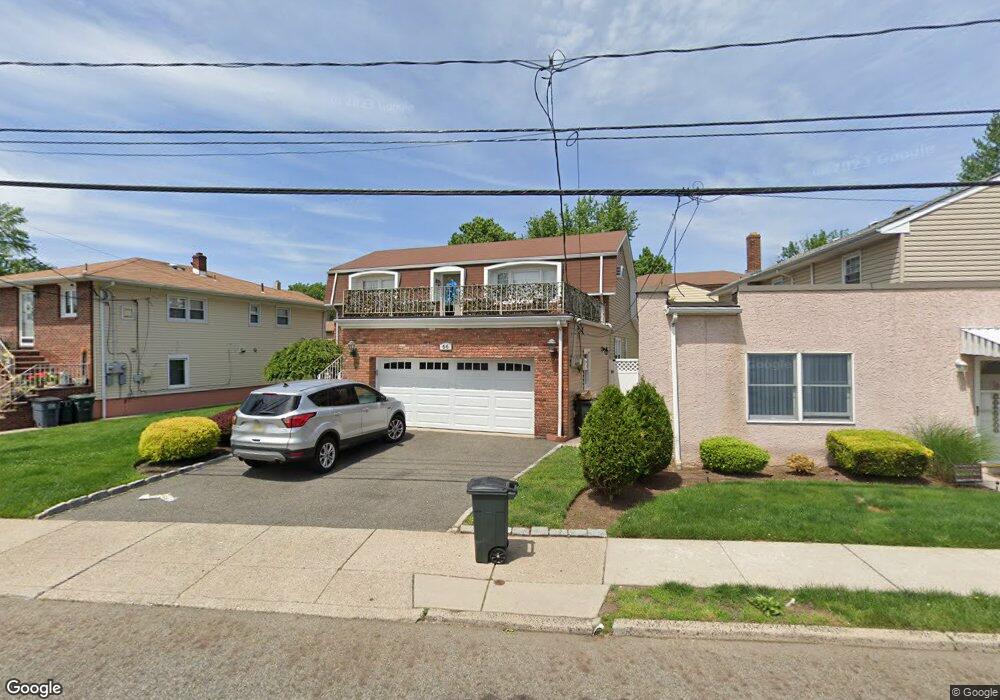
66 Calicooneck Rd South Hackensack, NJ 07606
Estimated Value: $865,167 - $993,000
4
Beds
3
Baths
2,584
Sq Ft
$352/Sq Ft
Est. Value
About This Home
This home is located at 66 Calicooneck Rd, South Hackensack, NJ 07606 and is currently estimated at $908,792, approximately $351 per square foot. 66 Calicooneck Rd is a home located in Bergen County with nearby schools including Memorial Elementary School and George Washington School.
Ownership History
Date
Name
Owned For
Owner Type
Purchase Details
Closed on
Nov 12, 2020
Sold by
Aquilina Anthony and Urdaz Aquilina Patricia
Bought by
Aguilar Javier E Romero and Aguilar Diana V
Current Estimated Value
Home Financials for this Owner
Home Financials are based on the most recent Mortgage that was taken out on this home.
Original Mortgage
$629,272
Interest Rate
2.7%
Mortgage Type
FHA
Purchase Details
Closed on
Aug 1, 2019
Sold by
Aquilina Jean
Bought by
Aquilina Anthony
Home Financials for this Owner
Home Financials are based on the most recent Mortgage that was taken out on this home.
Original Mortgage
$392,000
Interest Rate
3.7%
Mortgage Type
New Conventional
Purchase Details
Closed on
Jul 15, 2004
Purchase Details
Closed on
Mar 13, 2000
Sold by
Denoy John R
Bought by
Aquilina Jean A
Create a Home Valuation Report for This Property
The Home Valuation Report is an in-depth analysis detailing your home's value as well as a comparison with similar homes in the area
Home Values in the Area
Average Home Value in this Area
Purchase History
| Date | Buyer | Sale Price | Title Company |
|---|---|---|---|
| Aguilar Javier E Romero | $651,000 | Stewart Title Guaranty Co | |
| Aquilina Anthony | $490,000 | -- | |
| -- | -- | -- | |
| Aquilina Jean A | -- | -- | |
| Aquilina Jean A | -- | -- |
Source: Public Records
Mortgage History
| Date | Status | Borrower | Loan Amount |
|---|---|---|---|
| Previous Owner | Aguilar Javier E Romero | $629,272 | |
| Previous Owner | Aquilina Anthony | $392,000 |
Source: Public Records
Tax History
| Year | Tax Paid | Tax Assessment Tax Assessment Total Assessment is a certain percentage of the fair market value that is determined by local assessors to be the total taxable value of land and additions on the property. | Land | Improvement |
|---|---|---|---|---|
| 2025 | $14,109 | $776,800 | $232,800 | $544,000 |
| 2024 | $13,560 | $720,200 | $212,400 | $507,800 |
| 2023 | $13,100 | $636,300 | $195,800 | $440,500 |
| 2022 | $13,100 | $594,100 | $173,200 | $420,900 |
| 2021 | $13,248 | $525,300 | $154,200 | $371,100 |
| 2020 | $9,958 | $371,000 | $139,000 | $232,000 |
| 2019 | $9,555 | $349,600 | $137,100 | $212,500 |
| 2018 | $9,571 | $346,900 | $135,200 | $211,700 |
| 2017 | $9,431 | $339,500 | $131,400 | $208,100 |
| 2016 | $9,204 | $333,000 | $126,700 | $206,300 |
| 2015 | $8,963 | $326,400 | $122,900 | $203,500 |
| 2014 | $8,801 | $325,000 | $120,700 | $204,300 |
Source: Public Records
Map
Nearby Homes
- 460 Liberty St Unit 205
- 466B Liberty St
- 468 Liberty St Unit 201
- 462C Liberty St Unit 312
- 16 Maple Ave
- 466 Liberty St Unit 308
- 468a Liberty St Unit 101
- 85 Grove St
- 467 Hudson St
- 9 Vreeland Ave Unit 3A
- 337 Hudson St
- 23 Grand St
- 180 Main St
- 78 Poplar Ave
- 58 4th St
- 62 Frederick St Unit 1
- 43 Poplar Ave
- 113 Franklin St
- 14 Park St
- 39 Summit St
- 70 Calicooneck Rd
- 62 Calicooneck Rd
- 9 Williams Ave
- 504 Taylor Ave
- 60 Calicooneck Rd
- 500 Taylor Ave
- 17 Williams Ave
- 78 Calicooneck Rd
- 73 Calicooneck Rd
- 496 Taylor Ave
- 19 Williams Ave
- 65 Calicooneck Rd
- 50 Calicooneck Rd
- 82 Calicooneck Rd
- 12 Williams Ave
- 501 Taylor Ave
- 55 Calicooneck Rd
- 9 4th Ave
- 59 Calicooneck Rd
- 59 Calicooneck Rd Unit 2nd floor
Your Personal Tour Guide
Ask me questions while you tour the home.