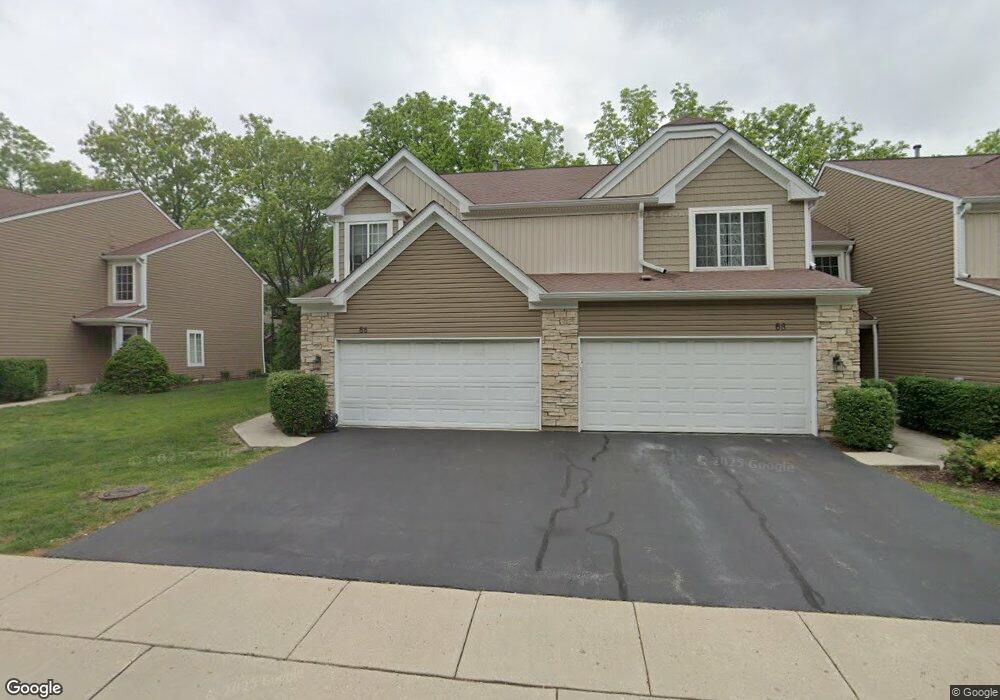
66 Cambridge Ave Streamwood, IL 60107
Estimated Value: $320,000 - $338,000
3
Beds
3
Baths
1,547
Sq Ft
$212/Sq Ft
Est. Value
About This Home
This home is located at 66 Cambridge Ave, Streamwood, IL 60107 and is currently estimated at $328,215, approximately $212 per square foot. 66 Cambridge Ave is a home located in Cook County with nearby schools including Heritage Elementary School, Tefft Middle School, and Streamwood High School.
Ownership History
Date
Name
Owned For
Owner Type
Purchase Details
Closed on
Jun 15, 2010
Sold by
Chana Davinder S and Chana Dawn L
Bought by
Ries Laury J
Current Estimated Value
Purchase Details
Closed on
Oct 14, 2002
Sold by
Gopinath Anil B and Gopinath Anil Latha
Bought by
Chana Davinder S and Chana Dawn L
Home Financials for this Owner
Home Financials are based on the most recent Mortgage that was taken out on this home.
Original Mortgage
$130,000
Interest Rate
6.18%
Purchase Details
Closed on
Jun 26, 1998
Sold by
Liberty Management Ltd Partnership Iii
Bought by
Gopinath Anil B and Gopinath Anil Latha
Home Financials for this Owner
Home Financials are based on the most recent Mortgage that was taken out on this home.
Original Mortgage
$139,550
Interest Rate
7.06%
Purchase Details
Closed on
Mar 15, 1995
Sold by
Goede C Wayne
Bought by
Liberty Management Ltd Partnerhip Iii
Create a Home Valuation Report for This Property
The Home Valuation Report is an in-depth analysis detailing your home's value as well as a comparison with similar homes in the area
Home Values in the Area
Average Home Value in this Area
Purchase History
| Date | Buyer | Sale Price | Title Company |
|---|---|---|---|
| Ries Laury J | $177,000 | First American Title | |
| Chana Davinder S | $195,000 | Stewart Title | |
| Gopinath Anil B | $147,000 | -- | |
| Liberty Management Ltd Partnerhip Iii | -- | -- |
Source: Public Records
Mortgage History
| Date | Status | Borrower | Loan Amount |
|---|---|---|---|
| Previous Owner | Chana Davinder S | $130,000 | |
| Previous Owner | Gopinath Anil B | $139,550 |
Source: Public Records
Tax History
| Year | Tax Paid | Tax Assessment Tax Assessment Total Assessment is a certain percentage of the fair market value that is determined by local assessors to be the total taxable value of land and additions on the property. | Land | Improvement |
|---|---|---|---|---|
| 2025 | $2,221 | $28,000 | $7,531 | $20,469 |
| 2024 | $2,221 | $22,585 | $3,502 | $19,083 |
| 2023 | $2,231 | $22,585 | $3,502 | $19,083 |
| 2022 | $2,231 | $22,585 | $3,502 | $19,083 |
| 2021 | $2,642 | $16,694 | $5,020 | $11,674 |
| 2020 | $2,419 | $16,694 | $5,020 | $11,674 |
| 2019 | $2,377 | $18,549 | $5,020 | $13,529 |
| 2018 | $2,625 | $16,345 | $4,393 | $11,952 |
| 2017 | $2,543 | $16,345 | $4,393 | $11,952 |
| 2016 | $3,203 | $16,345 | $4,393 | $11,952 |
| 2015 | $3,684 | $14,851 | $3,974 | $10,877 |
| 2014 | $3,552 | $14,851 | $3,974 | $10,877 |
| 2013 | $5,060 | $14,851 | $3,974 | $10,877 |
Source: Public Records
Map
Nearby Homes
- 132 Meredith Ln Unit 63
- 179 Locksley Dr
- 2074 Essex Ct Unit 2074
- 134 Virginia Ct
- 1341 Beverly Ln
- 128 Fairview Ln
- 105 Heritage Ln Unit 173T105
- 820 S Pine St
- 122 Brittany Dr Unit 16C2
- 12 E Pine St
- 916 Mulberry Ln
- 413 Lacy Ave
- 1108 Oak Ridge Dr
- 420 Ford Ln
- 11 E Streamwood Blvd
- 6 Dartmouth Ct
- 1005 Meadow Ln
- 107 W Streamwood Blvd
- 111 Cedar Cir
- 304 Patricia Ln
- 68 Cambridge Ave
- 60 Cambridge Ave
- 70 Cambridge Ave
- 72 Cambridge Ave
- 74 Cambridge Ave
- 39 Samuel Dr Unit 172
- 41 Samuel Dr Unit 171
- 37 Samuel Dr Unit 173
- 54 Cambridge Ave
- 33 Samuel Dr Unit 175
- 76 Cambridge Ave
- 63 Cambridge Ave
- 61 Cambridge Ave
- 31 Samuel Dr Unit 176
- 59 Cambridge Ave
- 57 Cambridge Ave
- 57 Cambridge Ave Unit AVE
- 82 Cambridge Ave
Your Personal Tour Guide
Ask me questions while you tour the home.