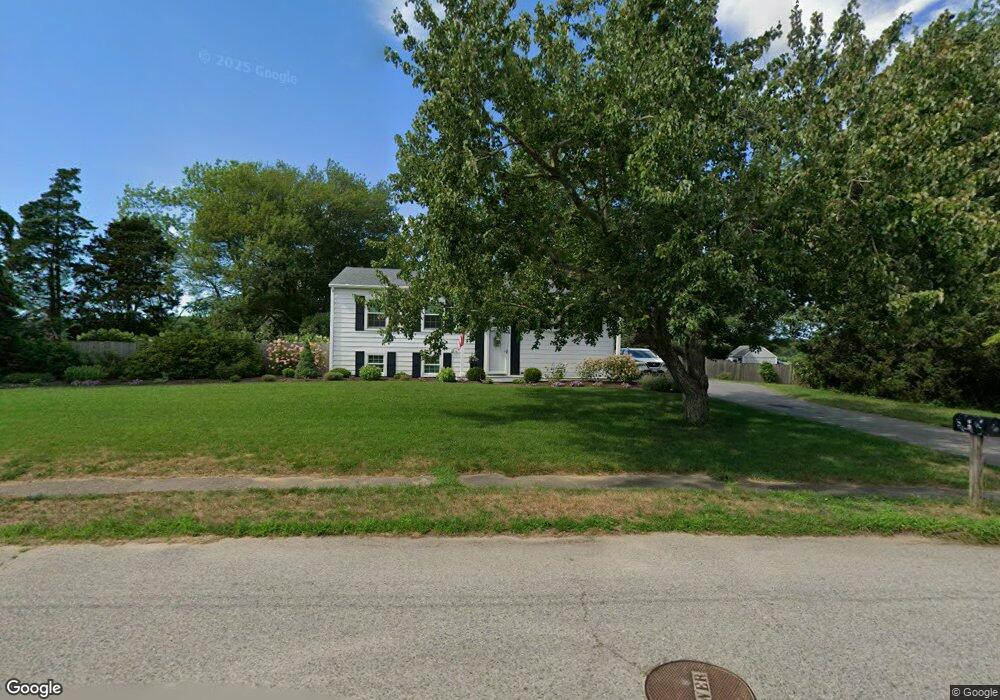
66 Chandler Dr Marshfield, MA 02050
Estimated Value: $705,318 - $762,000
3
Beds
2
Baths
1,080
Sq Ft
$679/Sq Ft
Est. Value
About This Home
This home is located at 66 Chandler Dr, Marshfield, MA 02050 and is currently estimated at $733,580, approximately $679 per square foot. 66 Chandler Dr is a home located in Plymouth County with nearby schools including Daniel Webster, Furnace Brook Middle School, and Marshfield High School.
Ownership History
Date
Name
Owned For
Owner Type
Purchase Details
Closed on
Jun 19, 2012
Sold by
Parmenter Karen A and Parmenter Robert J
Bought by
Parmenter Ft and Parmenter
Current Estimated Value
Create a Home Valuation Report for This Property
The Home Valuation Report is an in-depth analysis detailing your home's value as well as a comparison with similar homes in the area
Home Values in the Area
Average Home Value in this Area
Purchase History
| Date | Buyer | Sale Price | Title Company |
|---|---|---|---|
| Parmenter Ft | -- | -- | |
| Parmenter Ft | -- | -- |
Source: Public Records
Mortgage History
| Date | Status | Borrower | Loan Amount |
|---|---|---|---|
| Previous Owner | Parmenter Ft | $104,000 | |
| Previous Owner | Parmenter Ft | $65,000 |
Source: Public Records
Tax History Compared to Growth
Tax History
| Year | Tax Paid | Tax Assessment Tax Assessment Total Assessment is a certain percentage of the fair market value that is determined by local assessors to be the total taxable value of land and additions on the property. | Land | Improvement |
|---|---|---|---|---|
| 2025 | $6,412 | $647,700 | $362,000 | $285,700 |
| 2024 | $6,248 | $601,300 | $340,700 | $260,600 |
| 2023 | $5,663 | $532,300 | $306,600 | $225,700 |
| 2022 | $5,663 | $437,300 | $255,500 | $181,800 |
| 2021 | $5,599 | $424,500 | $255,500 | $169,000 |
| 2020 | $5,191 | $389,400 | $223,600 | $165,800 |
| 2019 | $5,103 | $381,400 | $223,600 | $157,800 |
| 2018 | $4,992 | $373,400 | $223,600 | $149,800 |
| 2017 | $4,860 | $354,200 | $223,600 | $130,600 |
| 2016 | $4,827 | $347,800 | $223,600 | $124,200 |
| 2015 | $4,480 | $337,100 | $212,900 | $124,200 |
| 2014 | $4,364 | $328,400 | $223,600 | $104,800 |
Source: Public Records
Map
Nearby Homes
- 30 Chandler Dr
- 11 Liberty Rd
- 643 S River St
- 32 Bourne Park Ave
- 35 Marshview Dr
- 112 Woodlawn Cir
- 311 S River St
- 37 Malden St
- 48 Norwell Rd
- 8 Duxbury St
- 91 Winslow St
- 18 Hunt Way
- 39 High Beacon Way
- 47 Brunswick St
- 51 Hatch St
- 16 Schooner Way
- 2104 Ocean St
- 207 Fairways Edge Dr
- 81 Constellation Rd
- 555 Webster St