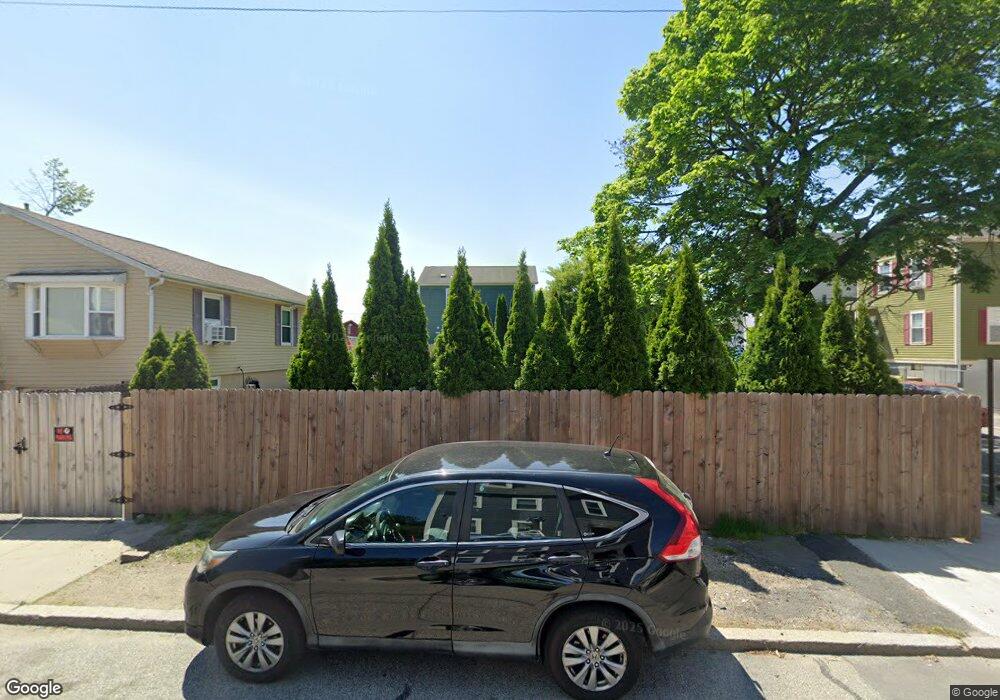
66 Colfax St Providence, RI 02905
Lower South Providence Neighborhood
3
Beds
1
Bath
960
Sq Ft
6,098
Sq Ft Lot
About This Home
This home is located at 66 Colfax St, Providence, RI 02905. 66 Colfax St is a home located in Providence County with nearby schools including Asa Messer Elementary School, Charles N. Fortes Elementary School, and Robert L. Bailey IV Elementary.
Ownership History
Date
Name
Owned For
Owner Type
Purchase Details
Closed on
Dec 30, 2016
Sold by
Negron Alexander
Bought by
Parra Ana M
Home Financials for this Owner
Home Financials are based on the most recent Mortgage that was taken out on this home.
Original Mortgage
$147,435
Outstanding Balance
$118,178
Interest Rate
3.37%
Mortgage Type
FHA
Purchase Details
Closed on
Sep 30, 1999
Sold by
Delgado Carlos M and Calcedo Oscar A
Bought by
Tamarez Miguel A
Home Financials for this Owner
Home Financials are based on the most recent Mortgage that was taken out on this home.
Original Mortgage
$30,400
Interest Rate
7.85%
Create a Home Valuation Report for This Property
The Home Valuation Report is an in-depth analysis detailing your home's value as well as a comparison with similar homes in the area
Home Values in the Area
Average Home Value in this Area
Purchase History
| Date | Buyer | Sale Price | Title Company |
|---|---|---|---|
| Parra Ana M | $159,900 | -- | |
| Tamarez Miguel A | $38,000 | -- |
Source: Public Records
Mortgage History
| Date | Status | Borrower | Loan Amount |
|---|---|---|---|
| Open | Parra Ana M | $147,435 | |
| Previous Owner | Tamarez Miguel A | $30,400 |
Source: Public Records
Tax History Compared to Growth
Tax History
| Year | Tax Paid | Tax Assessment Tax Assessment Total Assessment is a certain percentage of the fair market value that is determined by local assessors to be the total taxable value of land and additions on the property. | Land | Improvement |
|---|---|---|---|---|
| 2025 | $1,746 | $119,600 | $119,600 | $0 |
| 2024 | $486 | $26,500 | $26,500 | $0 |
| 2023 | $486 | $26,500 | $26,500 | $0 |
| 2022 | $472 | $26,500 | $26,500 | $0 |
| 2021 | $287 | $11,700 | $11,700 | $0 |
| 2020 | $287 | $11,700 | $11,700 | $0 |
| 2019 | $287 | $11,700 | $11,700 | $0 |
| 2018 | $339 | $10,600 | $10,600 | $0 |
| 2017 | $339 | $10,600 | $10,600 | $0 |
| 2016 | $339 | $10,600 | $10,600 | $0 |
| 2015 | $351 | $10,600 | $10,600 | $0 |
| 2014 | $358 | $10,600 | $10,600 | $0 |
| 2013 | $358 | $10,600 | $10,600 | $0 |
Source: Public Records
Map
Nearby Homes