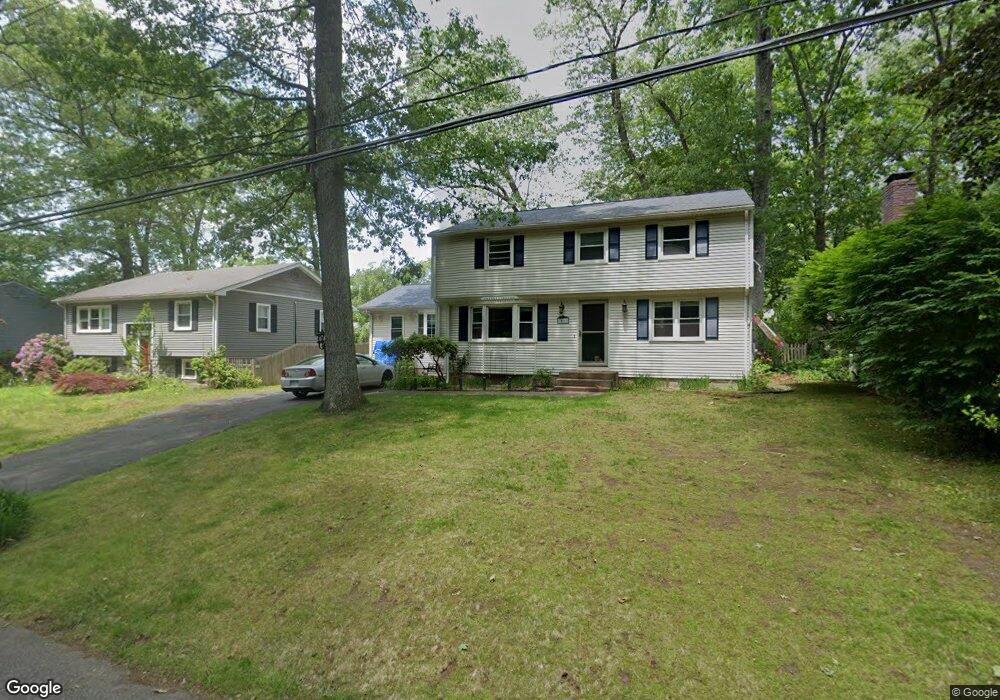
66 Colorado St Springfield, MA 01118
East Forest Park NeighborhoodEstimated Value: $336,000 - $391,000
4
Beds
3
Baths
2,088
Sq Ft
$172/Sq Ft
Est. Value
About This Home
This home is located at 66 Colorado St, Springfield, MA 01118 and is currently estimated at $358,900, approximately $171 per square foot. 66 Colorado St is a home located in Hampden County with nearby schools including Frederick Harris Elementary School, M Marcus Kiley Middle, and Springfield High School of Science and Technology.
Ownership History
Date
Name
Owned For
Owner Type
Purchase Details
Closed on
May 15, 2003
Sold by
Garrett Susan B and Boss Susan J
Bought by
Berg Robert C
Current Estimated Value
Home Financials for this Owner
Home Financials are based on the most recent Mortgage that was taken out on this home.
Original Mortgage
$73,500
Outstanding Balance
$32,061
Interest Rate
5.84%
Mortgage Type
Purchase Money Mortgage
Estimated Equity
$326,839
Create a Home Valuation Report for This Property
The Home Valuation Report is an in-depth analysis detailing your home's value as well as a comparison with similar homes in the area
Home Values in the Area
Average Home Value in this Area
Purchase History
| Date | Buyer | Sale Price | Title Company |
|---|---|---|---|
| Berg Robert C | $147,000 | -- |
Source: Public Records
Mortgage History
| Date | Status | Borrower | Loan Amount |
|---|---|---|---|
| Open | Berg Robert C | $73,500 |
Source: Public Records
Tax History
| Year | Tax Paid | Tax Assessment Tax Assessment Total Assessment is a certain percentage of the fair market value that is determined by local assessors to be the total taxable value of land and additions on the property. | Land | Improvement |
|---|---|---|---|---|
| 2025 | $5,138 | $327,700 | $47,600 | $280,100 |
| 2024 | $5,366 | $334,100 | $47,600 | $286,500 |
| 2023 | $4,994 | $292,900 | $45,300 | $247,600 |
| 2022 | $4,957 | $263,400 | $45,300 | $218,100 |
| 2021 | $4,387 | $232,100 | $41,200 | $190,900 |
| 2020 | $4,306 | $220,500 | $41,200 | $179,300 |
| 2019 | $4,359 | $221,500 | $41,200 | $180,300 |
| 2018 | $4,308 | $218,900 | $41,200 | $177,700 |
| 2017 | $3,940 | $200,400 | $41,200 | $159,200 |
| 2016 | $3,897 | $198,200 | $41,200 | $157,000 |
| 2015 | $3,765 | $191,400 | $41,200 | $150,200 |
Source: Public Records
Map
Nearby Homes
- 46 Hadley St
- 206 Treetop Ave
- 125 Manor Ct Unit 125
- 119 Powell Ave
- 19 Manor Ct Unit 19
- 17 Pebble Mill Rd
- 55 Allen St
- 65 Helen Cir
- 78 Wood Ave
- 0 Donald Ave
- 13 Bither St
- 161 Dorset St
- 26 Dwight Rd
- 1088 Sumner Ave
- 38 Manchester Terrace
- 34 Castle St
- 86 Talmadge Dr
- 79 Roosevelt Ave
- 33-35 Ruskin St
- 85 Talmadge Dr
Your Personal Tour Guide
Ask me questions while you tour the home.