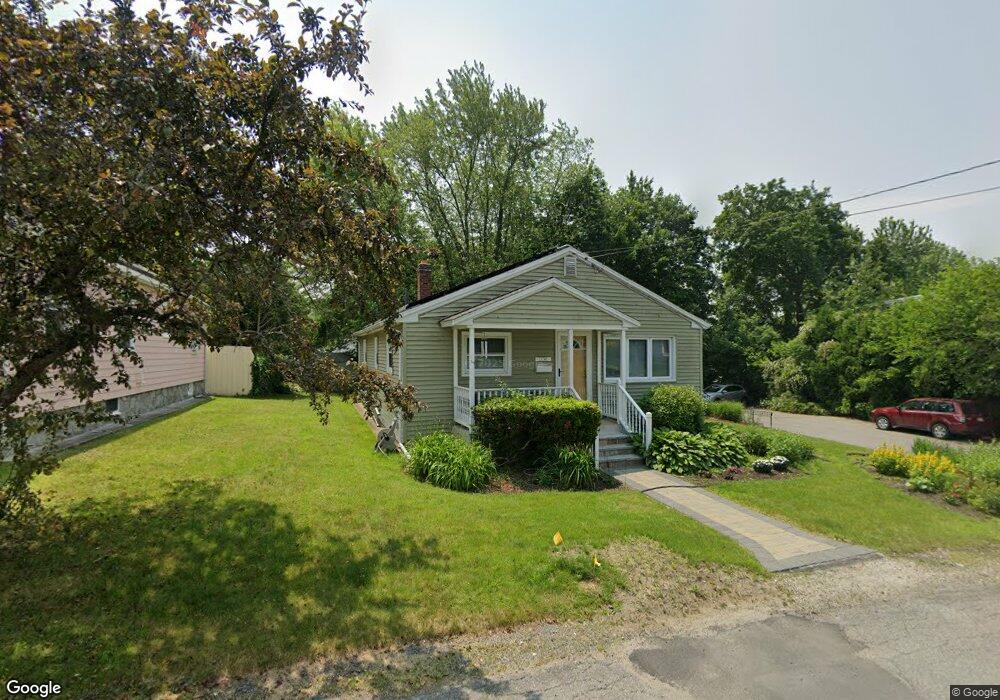
66 Columbia Rd Lowell, MA 01854
Pawtucketville NeighborhoodEstimated Value: $518,311 - $616,000
2
Beds
1
Bath
1,836
Sq Ft
$302/Sq Ft
Est. Value
About This Home
This home is located at 66 Columbia Rd, Lowell, MA 01854 and is currently estimated at $553,578, approximately $301 per square foot. 66 Columbia Rd is a home located in Middlesex County with nearby schools including Joseph McAvinnue Elementary School, Charlotte M. Murkland Elementary School, and Charles W. Morey Elementary School.
Ownership History
Date
Name
Owned For
Owner Type
Purchase Details
Closed on
Nov 7, 2003
Sold by
Brown Cynthia L and Brown Phillip M
Bought by
Nazzaro Kristine P and Nazzaro Stephen C
Current Estimated Value
Create a Home Valuation Report for This Property
The Home Valuation Report is an in-depth analysis detailing your home's value as well as a comparison with similar homes in the area
Home Values in the Area
Average Home Value in this Area
Purchase History
| Date | Buyer | Sale Price | Title Company |
|---|---|---|---|
| Nazzaro Kristine P | $233,900 | -- | |
| Nazzaro Kristine P | $233,900 | -- |
Source: Public Records
Mortgage History
| Date | Status | Borrower | Loan Amount |
|---|---|---|---|
| Open | Nazzaro Kristine P | $117,800 |
Source: Public Records
Tax History Compared to Growth
Tax History
| Year | Tax Paid | Tax Assessment Tax Assessment Total Assessment is a certain percentage of the fair market value that is determined by local assessors to be the total taxable value of land and additions on the property. | Land | Improvement |
|---|---|---|---|---|
| 2025 | $5,327 | $464,000 | $166,200 | $297,800 |
| 2024 | $5,019 | $421,400 | $155,300 | $266,100 |
| 2023 | $4,794 | $386,000 | $135,100 | $250,900 |
| 2022 | $4,514 | $355,700 | $122,800 | $232,900 |
| 2021 | $4,395 | $326,500 | $106,800 | $219,700 |
| 2020 | $4,056 | $303,600 | $109,000 | $194,600 |
| 2019 | $4,018 | $286,200 | $96,000 | $190,200 |
| 2018 | $3,825 | $265,800 | $91,400 | $174,400 |
| 2017 | $3,481 | $233,300 | $83,100 | $150,200 |
| 2016 | $3,268 | $215,600 | $77,500 | $138,100 |
| 2015 | $3,257 | $210,400 | $75,900 | $134,500 |
| 2013 | $3,134 | $208,800 | $95,400 | $113,400 |
Source: Public Records
Map
Nearby Homes
- 25 W 5th Ave
- 49 Tolman Ave
- 30 4th Ave
- 61 7th Ave W
- 89 Mammoth Rd
- 149 Woodward Ave
- 10 3rd Ave
- 81 5th Ave
- 33 W Meadow Rd
- 43 3rd Ave
- 10 Clinton Ave
- 107 7th Ave
- 113 5th Ave
- 380 University Ave
- 382 University Ave
- 1410 Skyline Dr Unit 9
- 1710 Skyline Dr Unit 10
- 1600 Skyline Dr Unit 2
- 2200 Skyline Dr Unit 5
- 25 Shea St Unit 8