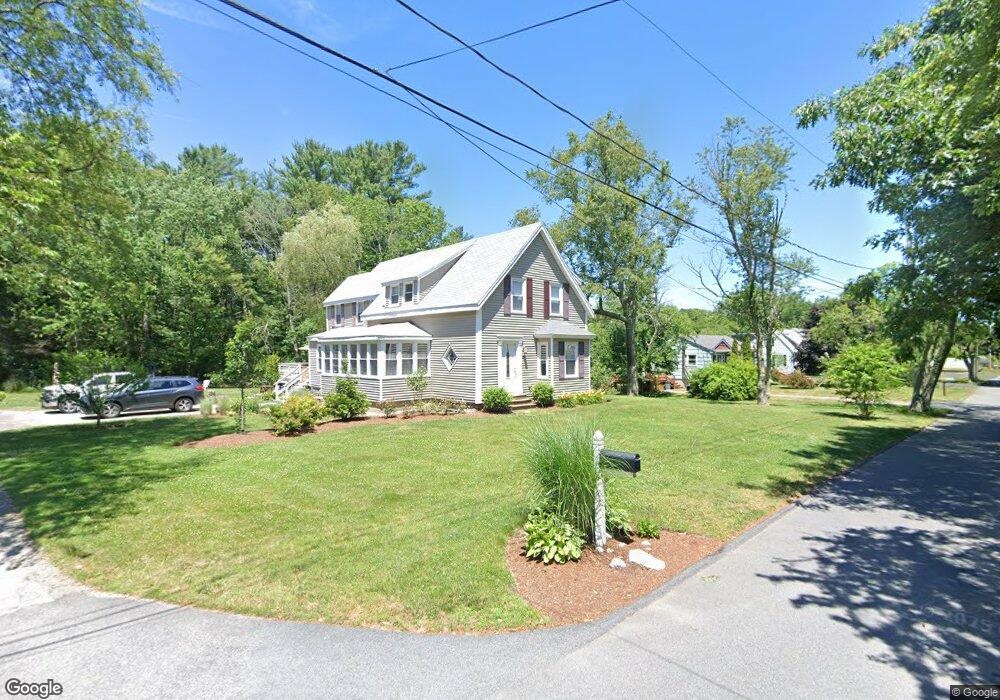
66 Crooker Place Hanson, MA 02341
Estimated Value: $644,000 - $709,000
4
Beds
2
Baths
2,195
Sq Ft
$306/Sq Ft
Est. Value
About This Home
This home is located at 66 Crooker Place, Hanson, MA 02341 and is currently estimated at $672,247, approximately $306 per square foot. 66 Crooker Place is a home located in Plymouth County.
Ownership History
Date
Name
Owned For
Owner Type
Purchase Details
Closed on
Feb 18, 2022
Sold by
Kelly Brian A
Bought by
Howland Matthew and Howland Jennifer
Current Estimated Value
Home Financials for this Owner
Home Financials are based on the most recent Mortgage that was taken out on this home.
Original Mortgage
$444,000
Outstanding Balance
$410,712
Interest Rate
3.55%
Mortgage Type
Purchase Money Mortgage
Estimated Equity
$261,535
Purchase Details
Closed on
Aug 31, 2000
Sold by
Corning George F and Corning Frances K
Bought by
Kelly Brian A
Create a Home Valuation Report for This Property
The Home Valuation Report is an in-depth analysis detailing your home's value as well as a comparison with similar homes in the area
Home Values in the Area
Average Home Value in this Area
Purchase History
| Date | Buyer | Sale Price | Title Company |
|---|---|---|---|
| Howland Matthew | $555,000 | None Available | |
| Kelly Brian A | $168,000 | -- |
Source: Public Records
Mortgage History
| Date | Status | Borrower | Loan Amount |
|---|---|---|---|
| Open | Howland Matthew | $444,000 | |
| Previous Owner | Kelly Brian A | $215,130 | |
| Previous Owner | Kelly Brian A | $15,187 | |
| Previous Owner | Kelly Brian A | $21,000 |
Source: Public Records
Tax History Compared to Growth
Tax History
| Year | Tax Paid | Tax Assessment Tax Assessment Total Assessment is a certain percentage of the fair market value that is determined by local assessors to be the total taxable value of land and additions on the property. | Land | Improvement |
|---|---|---|---|---|
| 2025 | $7,885 | $589,300 | $163,900 | $425,400 |
| 2024 | $7,657 | $572,300 | $159,100 | $413,200 |
| 2023 | $7,459 | $526,000 | $159,100 | $366,900 |
| 2022 | $6,928 | $459,100 | $144,600 | $314,500 |
| 2021 | $6,238 | $413,100 | $139,100 | $274,000 |
| 2020 | $5,781 | $378,600 | $134,400 | $244,200 |
| 2019 | $5,299 | $341,200 | $117,100 | $224,100 |
| 2018 | $3,780 | $238,800 | $112,600 | $126,200 |
| 2017 | $3,693 | $231,100 | $107,300 | $123,800 |
| 2016 | $3,777 | $228,200 | $107,300 | $120,900 |
| 2015 | $3,612 | $226,900 | $107,300 | $119,600 |
Source: Public Records
Map
Nearby Homes