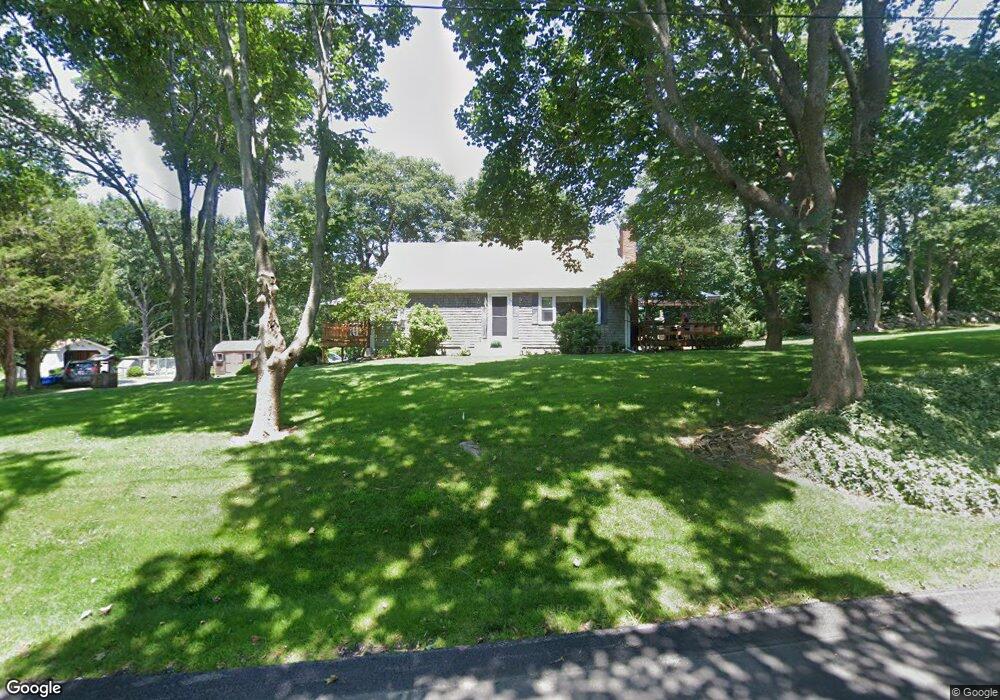
66 Cross Rd Westport, MA 02790
South Westport NeighborhoodEstimated Value: $576,000 - $818,000
1
Bed
2
Baths
1,680
Sq Ft
$422/Sq Ft
Est. Value
About This Home
This home is located at 66 Cross Rd, Westport, MA 02790 and is currently estimated at $709,333, approximately $422 per square foot. 66 Cross Rd is a home located in Bristol County with nearby schools including Alice A. Macomber Primary School, Westport Elementary School, and Westport Middle-High School.
Ownership History
Date
Name
Owned For
Owner Type
Purchase Details
Closed on
Oct 2, 2007
Sold by
Besse Cross Road T and Besse Kathleen
Bought by
Besse Kathleen and Besse Ronald E
Current Estimated Value
Purchase Details
Closed on
Sep 17, 2004
Sold by
Besse Ronald E
Bought by
Besse Cross Road T and Johnson Carole A
Create a Home Valuation Report for This Property
The Home Valuation Report is an in-depth analysis detailing your home's value as well as a comparison with similar homes in the area
Home Values in the Area
Average Home Value in this Area
Purchase History
| Date | Buyer | Sale Price | Title Company |
|---|---|---|---|
| Besse Kathleen | -- | -- | |
| Besse Cross Road T | -- | -- |
Source: Public Records
Mortgage History
| Date | Status | Borrower | Loan Amount |
|---|---|---|---|
| Open | Besse Cross Road T | $98,000 | |
| Closed | Besse Cross Road T | $100,000 | |
| Previous Owner | Besse Cross Road T | $110,000 |
Source: Public Records
Tax History Compared to Growth
Tax History
| Year | Tax Paid | Tax Assessment Tax Assessment Total Assessment is a certain percentage of the fair market value that is determined by local assessors to be the total taxable value of land and additions on the property. | Land | Improvement |
|---|---|---|---|---|
| 2025 | $3,161 | $424,300 | $212,300 | $212,000 |
| 2024 | $3,125 | $404,300 | $196,700 | $207,600 |
| 2023 | $2,800 | $343,100 | $147,200 | $195,900 |
| 2022 | $2,586 | $313,400 | $147,200 | $166,200 |
| 2021 | $2,586 | $300,000 | $133,800 | $166,200 |
| 2020 | $2,483 | $294,600 | $128,400 | $166,200 |
| 2019 | $2,379 | $287,700 | $128,400 | $159,300 |
| 2018 | $4,622 | $320,700 | $176,300 | $144,400 |
| 2017 | $2,573 | $322,800 | $176,300 | $146,500 |
| 2016 | $2,505 | $316,700 | $176,300 | $140,400 |
| 2015 | $2,467 | $311,100 | $176,300 | $134,800 |
Source: Public Records
Map
Nearby Homes
- Lot 2 Horseneck Rd
- 99 Sylvia Ln
- Lot 2E Horseneck Rd
- 1702 Drift Rd
- 1702J Drift Rd
- 2 Slades Farm Ln
- 238-242 E Beach Rd
- 1881 Main Rd
- 1749 Main Rd
- 1580 Main Rd
- 61 Pardon Hill Rd
- Lot 1 Rafael Rd
- 1150 Russells Mills Rd
- 225 Hixbridge Rd
- 1346 Main Rd Unit B
- 920 Drift Rd
- 24 White Alder Way
- 158 Little River Rd
- 73 White Oak Run
- 105 Rock Odundee Rd