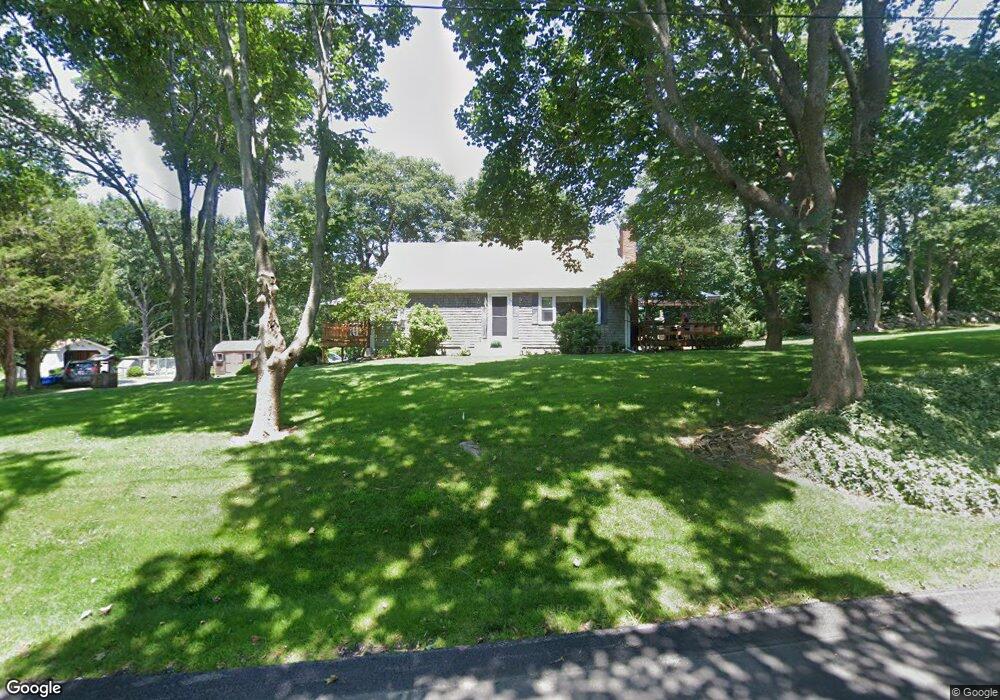
66 Cross Rd Westport, MA 02790
South Westport NeighborhoodEstimated Value: $466,000 - $784,000
1
Bed
2
Baths
1,680
Sq Ft
$371/Sq Ft
Est. Value
About This Home
This home is located at 66 Cross Rd, Westport, MA 02790 and is currently estimated at $623,333, approximately $371 per square foot. 66 Cross Rd is a home located in Bristol County with nearby schools including Alice A. Macomber Primary School, Westport Elementary School, and Westport Middle-High School.
Ownership History
Date
Name
Owned For
Owner Type
Purchase Details
Closed on
Oct 2, 2007
Sold by
Besse Cross Road T and Besse Kathleen
Bought by
Besse Kathleen and Besse Ronald E
Current Estimated Value
Purchase Details
Closed on
Sep 17, 2004
Sold by
Besse Ronald E
Bought by
Besse Cross Road T and Johnson Carole A
Create a Home Valuation Report for This Property
The Home Valuation Report is an in-depth analysis detailing your home's value as well as a comparison with similar homes in the area
Home Values in the Area
Average Home Value in this Area
Purchase History
We collect this data history from publicly available records. To have your information removed, we recommend requesting removal directly through your county’s website.
| Date | Buyer | Sale Price | Title Company |
|---|---|---|---|
| Besse Kathleen | -- | -- | |
| Besse Cross Road T | -- | -- |
Source: Public Records
Mortgage History
We collect this data history from publicly available records. To have your information removed, we recommend requesting removal directly through your county’s website.
| Date | Status | Borrower | Loan Amount |
|---|---|---|---|
| Open | Besse Cross Road T | $98,000 | |
| Closed | Besse Cross Road T | $100,000 | |
| Previous Owner | Besse Cross Road T | $110,000 |
Source: Public Records
Tax History
| Year | Tax Paid | Tax Assessment Tax Assessment Total Assessment is a certain percentage of the fair market value that is determined by local assessors to be the total taxable value of land and additions on the property. | Land | Improvement |
|---|---|---|---|---|
| 2025 | $3,161 | $424,300 | $212,300 | $212,000 |
| 2024 | $3,125 | $404,300 | $196,700 | $207,600 |
| 2023 | $2,800 | $343,100 | $147,200 | $195,900 |
| 2022 | $2,586 | $313,400 | $147,200 | $166,200 |
| 2021 | $2,586 | $300,000 | $133,800 | $166,200 |
| 2020 | $2,483 | $294,600 | $128,400 | $166,200 |
| 2019 | $2,379 | $287,700 | $128,400 | $159,300 |
| 2018 | $4,622 | $320,700 | $176,300 | $144,400 |
| 2017 | $2,573 | $322,800 | $176,300 | $146,500 |
| 2016 | $2,505 | $316,700 | $176,300 | $140,400 |
| 2015 | $2,467 | $311,100 | $176,300 | $134,800 |
Source: Public Records
Map
Nearby Homes
- 2 Olin Howland Way
- 332 Division Rd
- 16 Wadsworth Ln
- 22 3rd St
- 7 Olin Howland Way
- 6 Moxen Ln
- 238/242 E Beach Rd
- 98 Horseneck Rd
- 7 Taber Ln
- 408 Hixbridge Rd
- Lot 1 Rafael Rd
- 9 Division Rd
- 1150 Russells Mills Rd
- 225 Hixbridge Rd
- 920 Drift Rd
- 922 Drift Rd
- 1 Puddingstone Cir
- 105 Rock Odundee Rd
- 482 Smith Neck Rd
- 129 Cross Rd
Your Personal Tour Guide
Ask me questions while you tour the home.