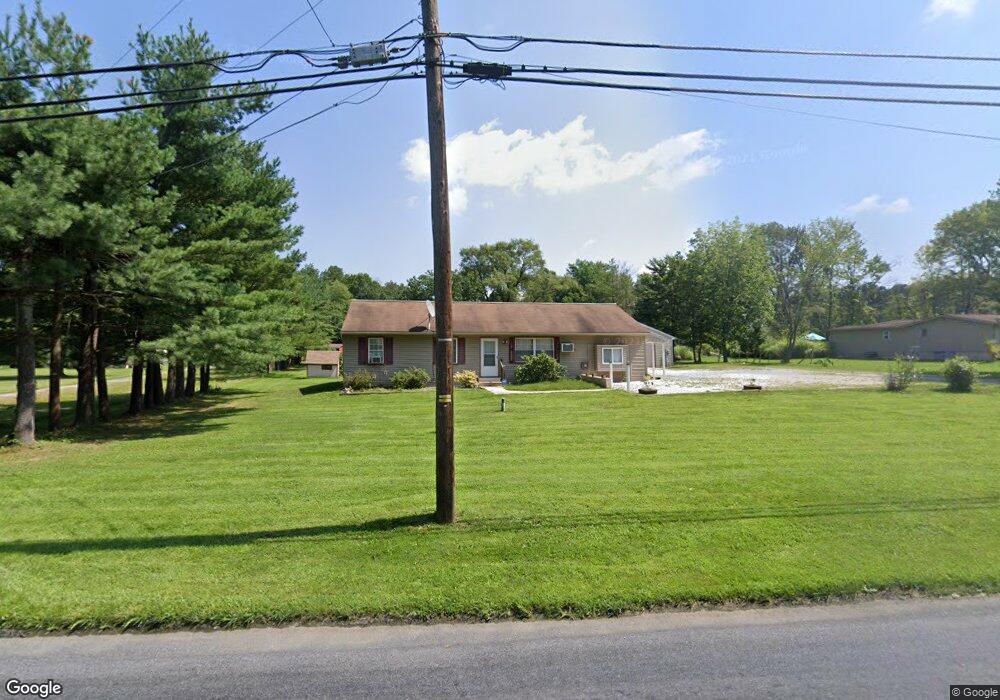
66 Cupola Rd Honey Brook, PA 19344
Estimated Value: $324,000 - $422,000
3
Beds
2
Baths
1,568
Sq Ft
$228/Sq Ft
Est. Value
About This Home
This home is located at 66 Cupola Rd, Honey Brook, PA 19344 and is currently estimated at $357,185, approximately $227 per square foot. 66 Cupola Rd is a home located in Chester County with nearby schools including Honey Brook Elementary Center, Twin Valley Middle School, and Twin Valley High School.
Ownership History
Date
Name
Owned For
Owner Type
Purchase Details
Closed on
Oct 17, 2016
Sold by
Stoltzfus Barbara
Bought by
Stoltzfus Emanuel B and Stoltzfus Emma F
Current Estimated Value
Purchase Details
Closed on
Feb 26, 2016
Sold by
Stoltzfus Emanuel B and Stoltzfus Emma F
Bought by
Stoltzfus Barbara
Home Financials for this Owner
Home Financials are based on the most recent Mortgage that was taken out on this home.
Original Mortgage
$65,000
Outstanding Balance
$51,713
Interest Rate
3.97%
Mortgage Type
Purchase Money Mortgage
Estimated Equity
$305,472
Purchase Details
Closed on
Dec 30, 2015
Sold by
Scaramuzzino Joseph S and Scaramuzzino Mary M
Bought by
Stoltzfus Emanuel B and Stoltzfus Emma F
Home Financials for this Owner
Home Financials are based on the most recent Mortgage that was taken out on this home.
Original Mortgage
$65,000
Outstanding Balance
$51,713
Interest Rate
3.97%
Mortgage Type
Purchase Money Mortgage
Estimated Equity
$305,472
Create a Home Valuation Report for This Property
The Home Valuation Report is an in-depth analysis detailing your home's value as well as a comparison with similar homes in the area
Home Values in the Area
Average Home Value in this Area
Purchase History
| Date | Buyer | Sale Price | Title Company |
|---|---|---|---|
| Stoltzfus Emanuel B | -- | Attorney | |
| Stoltzfus Barbara | -- | Attorney | |
| Stoltzfus Emanuel B | $175,000 | Attorney |
Source: Public Records
Mortgage History
| Date | Status | Borrower | Loan Amount |
|---|---|---|---|
| Open | Stoltzfus Emanuel B | $65,000 |
Source: Public Records
Tax History Compared to Growth
Tax History
| Year | Tax Paid | Tax Assessment Tax Assessment Total Assessment is a certain percentage of the fair market value that is determined by local assessors to be the total taxable value of land and additions on the property. | Land | Improvement |
|---|---|---|---|---|
| 2025 | $3,708 | $96,570 | $31,550 | $65,020 |
| 2024 | $3,708 | $96,570 | $31,550 | $65,020 |
| 2023 | $3,623 | $96,570 | $31,550 | $65,020 |
| 2022 | $3,583 | $96,570 | $31,550 | $65,020 |
| 2021 | $3,479 | $96,570 | $31,550 | $65,020 |
| 2020 | $3,461 | $96,570 | $31,550 | $65,020 |
| 2019 | $3,358 | $96,570 | $31,550 | $65,020 |
| 2018 | $3,358 | $96,570 | $31,550 | $65,020 |
| 2017 | $3,279 | $96,570 | $31,550 | $65,020 |
| 2016 | $3,091 | $109,820 | $31,550 | $78,270 |
| 2015 | $3,091 | $109,820 | $31,550 | $78,270 |
| 2014 | $3,091 | $109,820 | $31,550 | $78,270 |
Source: Public Records
Map
Nearby Homes