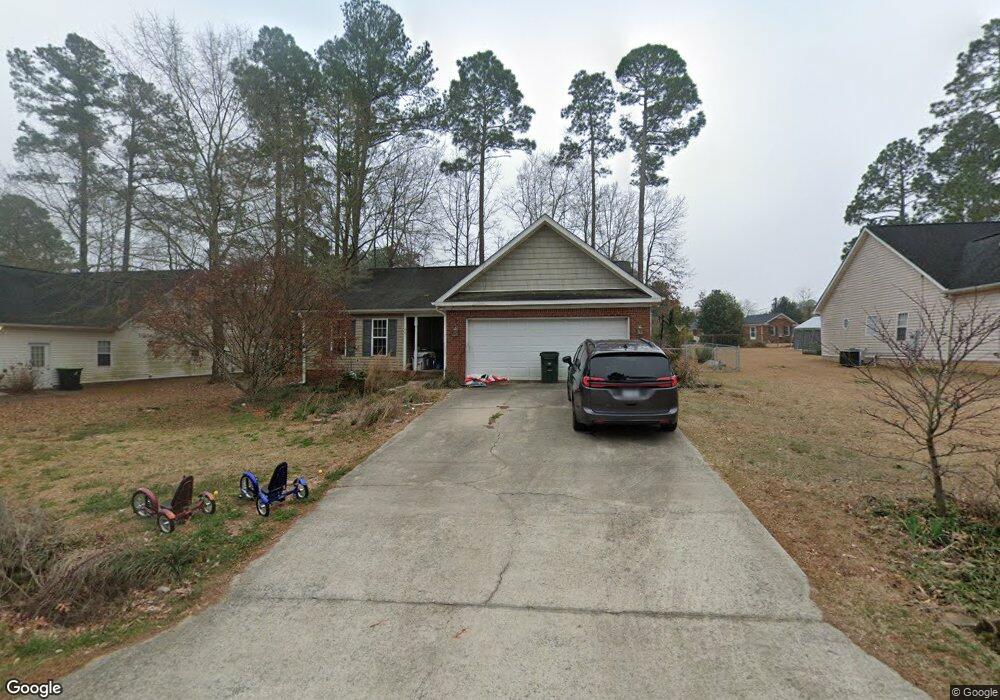
66 Dawn Ave Four Oaks, NC 27524
Ingrams NeighborhoodEstimated Value: $279,000 - $317,000
3
Beds
2
Baths
1,463
Sq Ft
$199/Sq Ft
Est. Value
About This Home
This home is located at 66 Dawn Ave, Four Oaks, NC 27524 and is currently estimated at $291,228, approximately $199 per square foot. 66 Dawn Ave is a home located in Johnston County with nearby schools including Four Oaks Elementary School, Four Oaks Middle School, and South Johnston High School.
Ownership History
Date
Name
Owned For
Owner Type
Purchase Details
Closed on
Jul 23, 2019
Sold by
Beamon Cynthia Ann Cone and Beamon Charles Keith
Bought by
Thompson Chance R and Thompson Mary Margaiet
Current Estimated Value
Home Financials for this Owner
Home Financials are based on the most recent Mortgage that was taken out on this home.
Original Mortgage
$160,000
Outstanding Balance
$140,174
Interest Rate
3.82%
Mortgage Type
New Conventional
Estimated Equity
$151,054
Purchase Details
Closed on
Sep 29, 2005
Sold by
Heritage Homes Of Clayton Inc
Bought by
Cone Cynthia Ann
Home Financials for this Owner
Home Financials are based on the most recent Mortgage that was taken out on this home.
Original Mortgage
$126,800
Interest Rate
5.25%
Mortgage Type
Adjustable Rate Mortgage/ARM
Purchase Details
Closed on
Aug 20, 2004
Sold by
Heritage Homes Of Clayton
Bought by
Ricks Ronnie
Create a Home Valuation Report for This Property
The Home Valuation Report is an in-depth analysis detailing your home's value as well as a comparison with similar homes in the area
Home Values in the Area
Average Home Value in this Area
Purchase History
| Date | Buyer | Sale Price | Title Company |
|---|---|---|---|
| Thompson Chance R | $175,000 | None Available | |
| Cone Cynthia Ann | $130,000 | None Available | |
| Ricks Ronnie | -- | -- |
Source: Public Records
Mortgage History
| Date | Status | Borrower | Loan Amount |
|---|---|---|---|
| Open | Thompson Chance R | $160,000 | |
| Previous Owner | Cone Cynthia Ann | $126,800 |
Source: Public Records
Tax History Compared to Growth
Tax History
| Year | Tax Paid | Tax Assessment Tax Assessment Total Assessment is a certain percentage of the fair market value that is determined by local assessors to be the total taxable value of land and additions on the property. | Land | Improvement |
|---|---|---|---|---|
| 2025 | $2,281 | $249,330 | $29,410 | $219,920 |
| 2024 | $1,715 | $144,740 | $13,370 | $131,370 |
| 2023 | $1,686 | $144,740 | $13,370 | $131,370 |
| 2022 | $1,708 | $144,740 | $13,370 | $131,370 |
| 2021 | $1,708 | $144,740 | $13,370 | $131,370 |
| 2020 | $1,751 | $144,740 | $13,370 | $131,370 |
| 2019 | $1,751 | $144,740 | $13,370 | $131,370 |
| 2018 | $1,517 | $123,320 | $8,020 | $115,300 |
| 2017 | $1,480 | $123,320 | $8,020 | $115,300 |
| 2016 | $1,480 | $123,320 | $8,020 | $115,300 |
| 2015 | $1,431 | $123,320 | $8,020 | $115,300 |
| 2014 | $1,431 | $123,320 | $8,020 | $115,300 |
Source: Public Records
Map
Nearby Homes
- 233 Meadow Hills Dr
- 36 Kevior Ave
- 125 Evans St
- 600 N Baker St
- 110 Grady St
- 500 N Main St
- 0 N Main St
- 202 Austin St Unit A
- 315 S Main St
- 16 Salt Life Place
- 846 Barbour Farm Ln
- 203 S Main St Unit A
- 106 W North Railroad St
- 207 S Main St Unit B
- 207 S Main St Unit A
- 228 Pecan Valley Way
- 189 Pecan Valley Way
- 169 Pecan Valley Way
- 103 E Allen St
- 247 Pecan Valley Way