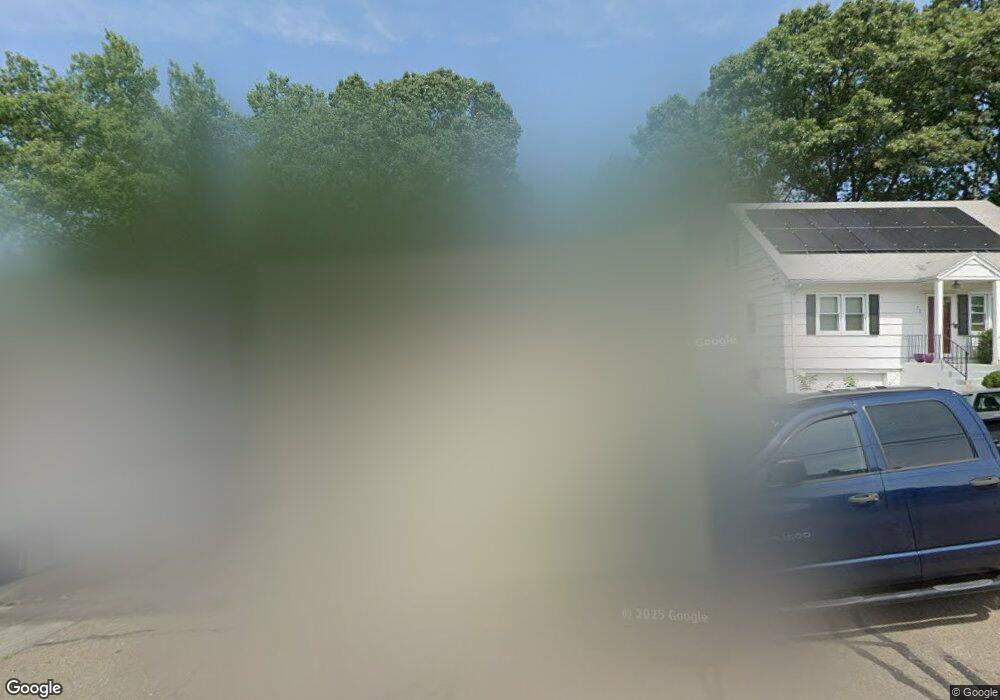
66 Douglas St Bridgeport, CT 06606
Reservoir-Whiskey Hill NeighborhoodEstimated Value: $318,000 - $417,000
3
Beds
2
Baths
1,031
Sq Ft
$342/Sq Ft
Est. Value
About This Home
This home is located at 66 Douglas St, Bridgeport, CT 06606 and is currently estimated at $352,533, approximately $341 per square foot. 66 Douglas St is a home located in Fairfield County with nearby schools including Hallen School, Central High School, and Northeastern Adventist Academy - Fairfield County.
Ownership History
Date
Name
Owned For
Owner Type
Purchase Details
Closed on
Feb 14, 2011
Sold by
Occhino Michael A
Bought by
Bailey Timikia S
Current Estimated Value
Home Financials for this Owner
Home Financials are based on the most recent Mortgage that was taken out on this home.
Original Mortgage
$134,450
Outstanding Balance
$92,437
Interest Rate
4.88%
Estimated Equity
$260,096
Purchase Details
Closed on
Apr 12, 2010
Sold by
Us Bk
Bought by
Occhino Michael A and Occhino Susan
Purchase Details
Closed on
Feb 1, 2010
Sold by
Hayes Nancy
Bought by
Us Bk
Purchase Details
Closed on
Sep 7, 2001
Sold by
Hayes Gwendolyn D
Bought by
Hayes Nancy
Purchase Details
Closed on
Aug 31, 1992
Sold by
Federal Home Loan Mortgage Corporation
Bought by
Hayes Gwendolyn
Create a Home Valuation Report for This Property
The Home Valuation Report is an in-depth analysis detailing your home's value as well as a comparison with similar homes in the area
Home Values in the Area
Average Home Value in this Area
Purchase History
| Date | Buyer | Sale Price | Title Company |
|---|---|---|---|
| Bailey Timikia S | $138,000 | -- | |
| Bailey Timikia S | $138,000 | -- | |
| Occhino Michael A | $62,500 | -- | |
| Occhino Michael A | $62,500 | -- | |
| Us Bk | -- | -- | |
| Us Bk | -- | -- | |
| Hayes Nancy | $118,000 | -- | |
| Hayes Nancy | $118,000 | -- | |
| Hayes Gwendolyn | $43,775 | -- | |
| Hayes Gwendolyn | $43,775 | -- |
Source: Public Records
Mortgage History
| Date | Status | Borrower | Loan Amount |
|---|---|---|---|
| Open | Hayes Gwendolyn | $134,450 | |
| Closed | Hayes Gwendolyn | $134,450 |
Source: Public Records
Tax History Compared to Growth
Tax History
| Year | Tax Paid | Tax Assessment Tax Assessment Total Assessment is a certain percentage of the fair market value that is determined by local assessors to be the total taxable value of land and additions on the property. | Land | Improvement |
|---|---|---|---|---|
| 2025 | $5,675 | $130,600 | $61,680 | $68,920 |
| 2024 | $5,675 | $130,600 | $61,680 | $68,920 |
| 2023 | $5,675 | $130,600 | $61,680 | $68,920 |
| 2022 | $5,675 | $130,600 | $61,680 | $68,920 |
| 2021 | $5,675 | $130,600 | $61,680 | $68,920 |
| 2020 | $5,083 | $94,150 | $35,500 | $58,650 |
| 2019 | $5,083 | $94,150 | $35,500 | $58,650 |
| 2018 | $5,119 | $94,150 | $35,500 | $58,650 |
| 2017 | $5,119 | $94,150 | $35,500 | $58,650 |
| 2016 | $5,119 | $94,150 | $35,500 | $58,650 |
| 2015 | $5,029 | $119,180 | $40,700 | $78,480 |
| 2014 | $5,029 | $119,180 | $40,700 | $78,480 |
Source: Public Records
Map
Nearby Homes
- 285 Alba Ave
- 410 Alba Ave
- 45 Polk St
- 365 Platt St
- 500 Woodlawn Avenue Extension
- 717 Reservoir Ave
- 705 Reservoir Ave
- 7 Stone Ridge Rd
- 130 Wilkins Ave
- 110 Wilkins Ave
- 36 Platt St
- 28 Wilkins Ave
- 385 Chamberlain Ave
- 769 Sylvan Ave Unit 16
- 769 Sylvan Ave Unit 13
- 123 Exeter St
- 355 Chamberlain Ave
- 26 Karen Ct Unit A
- 165 Yaremich Dr
- 330 Oakwood St