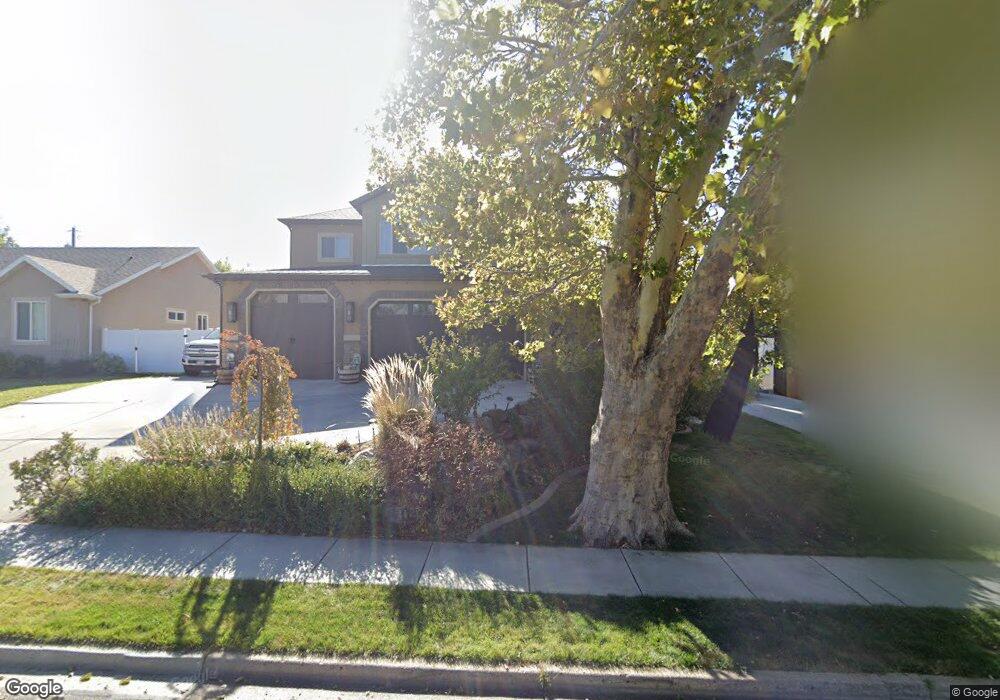
66 E 1200 S Bountiful, UT 84010
Estimated Value: $894,000 - $1,057,563
5
Beds
4
Baths
4,745
Sq Ft
$206/Sq Ft
Est. Value
About This Home
This home is located at 66 E 1200 S, Bountiful, UT 84010 and is currently estimated at $975,391, approximately $205 per square foot. 66 E 1200 S is a home located in Davis County with nearby schools including Bountiful Elementary School, Millcreek Junior High School, and Bountiful High School.
Ownership History
Date
Name
Owned For
Owner Type
Purchase Details
Closed on
Oct 26, 2020
Sold by
Willey Todd S and The Todd S Willey Trust
Bought by
Rhead Eric
Current Estimated Value
Home Financials for this Owner
Home Financials are based on the most recent Mortgage that was taken out on this home.
Original Mortgage
$620,150
Outstanding Balance
$546,579
Interest Rate
2.9%
Mortgage Type
New Conventional
Estimated Equity
$428,812
Purchase Details
Closed on
May 30, 2018
Sold by
Willy Todd S
Bought by
Willey Todd S and Willey Trust
Purchase Details
Closed on
Oct 1, 2013
Sold by
Johnson Alice S
Bought by
Willey Todd S
Home Financials for this Owner
Home Financials are based on the most recent Mortgage that was taken out on this home.
Original Mortgage
$240,000
Interest Rate
4.57%
Mortgage Type
New Conventional
Purchase Details
Closed on
Feb 15, 2012
Sold by
Security Investment Ltd
Bought by
Johnson Alice S
Create a Home Valuation Report for This Property
The Home Valuation Report is an in-depth analysis detailing your home's value as well as a comparison with similar homes in the area
Purchase History
| Date | Buyer | Sale Price | Title Company |
|---|---|---|---|
| Rhead Eric | -- | Stewart Title Insurance Agcy | |
| Willey Todd S | -- | None Available | |
| Willey Todd S | -- | Mountain View Title & | |
| Johnson Alice S | -- | None Available |
Source: Public Records
Mortgage History
| Date | Status | Borrower | Loan Amount |
|---|---|---|---|
| Open | Rhead Eric | $620,150 | |
| Previous Owner | Willey Todd S | $240,000 |
Source: Public Records
Tax History
| Year | Tax Paid | Tax Assessment Tax Assessment Total Assessment is a certain percentage of the fair market value that is determined by local assessors to be the total taxable value of land and additions on the property. | Land | Improvement |
|---|---|---|---|---|
| 2025 | $5,549 | $521,400 | $140,770 | $380,630 |
| 2024 | $5,321 | $514,250 | $128,402 | $385,848 |
| 2023 | $5,116 | $896,000 | $233,811 | $662,189 |
| 2022 | $5,339 | $513,150 | $127,027 | $386,123 |
| 2021 | $4,753 | $699,000 | $166,347 | $532,653 |
| 2020 | $3,445 | $478,000 | $141,105 | $336,895 |
| 2019 | $3,467 | $470,000 | $142,442 | $327,558 |
| 2018 | $3,343 | $438,000 | $139,480 | $298,520 |
| 2016 | $2,789 | $200,640 | $59,798 | $140,842 |
| 2015 | $2,704 | $183,260 | $59,798 | $123,462 |
| 2014 | $2,889 | $204,009 | $59,798 | $144,211 |
| 2013 | -- | $59,840 | $43,945 | $15,895 |
Source: Public Records
Map
Nearby Homes
- 141 E 1650 S
- 1350 S 200 W
- 380 E 1500 S
- 1820 S 50 W
- 1314 S 200 W Unit 19
- 190 W 1800 S
- 545 S 100 E
- 650 S Main St Unit 7107
- 650 S Main St Unit 6206
- 650 S Main St Unit 4104
- 650 S Main St Unit 9106
- 323 Peach Ln
- 275 E Peach Ln S
- 2 E Wicker Ln
- 1940 S 200 W Unit 3
- 1016 S 400 W
- 2064 S Orchard Dr
- 34 W 400 S
- 188 E 2050 S Unit D3
- 32 W 400 S
Your Personal Tour Guide
Ask me questions while you tour the home.