Estimated Value: $505,000 - $723,000
5
Beds
3
Baths
2,994
Sq Ft
$189/Sq Ft
Est. Value
About This Home
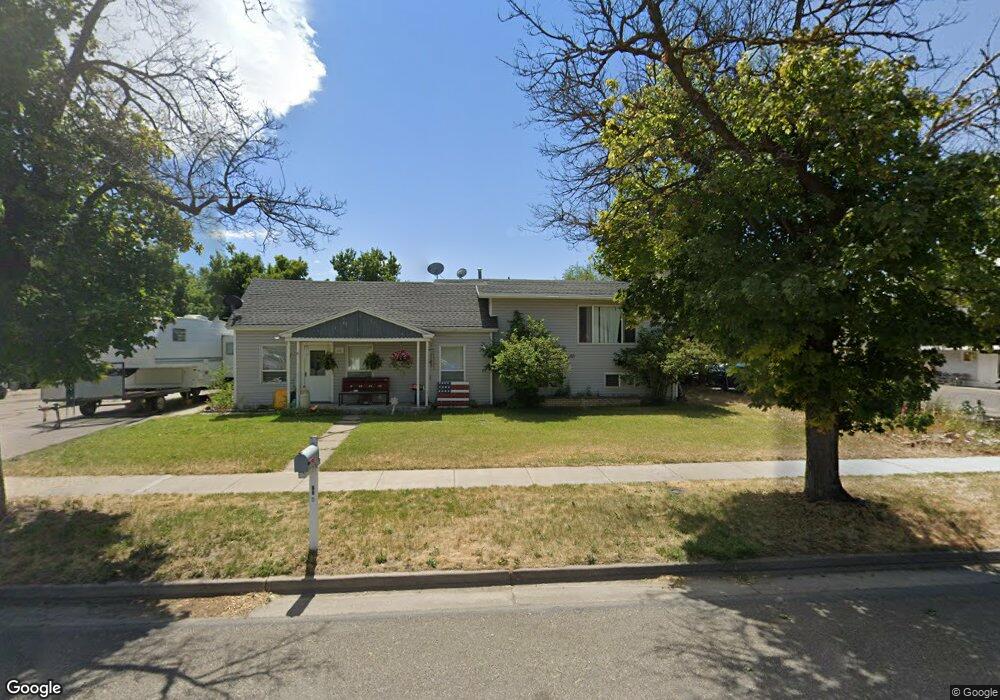
This home is located at 66 E Main St, Hyrum, UT 84319 and is currently estimated at $566,071, approximately $189 per square foot. 66 E Main St is a home located in Cache County with nearby schools including Lincoln School, South Cache Middle School, and Mountain Crest High School.
Ownership History
Date
Name
Owned For
Owner Type
Purchase Details
Closed on
Nov 14, 2007
Sold by
Webb Brendon J and Webb Tamara
Bought by
Harrington & Company
Current Estimated Value
Purchase Details
Closed on
Oct 17, 2006
Sold by
Webb Brendon J
Bought by
Webb Brendon J and Webb Tamara
Home Financials for this Owner
Home Financials are based on the most recent Mortgage that was taken out on this home.
Original Mortgage
$138,000
Interest Rate
6.46%
Mortgage Type
Negative Amortization
Purchase Details
Closed on
Oct 16, 2006
Sold by
Webb Brendon J and Webb Tamara
Bought by
Webb Brendon J
Home Financials for this Owner
Home Financials are based on the most recent Mortgage that was taken out on this home.
Original Mortgage
$138,000
Interest Rate
6.46%
Mortgage Type
Negative Amortization
Purchase Details
Closed on
Aug 30, 2005
Sold by
Webb Brendon J
Bought by
Webb Brendon J and Webb Tamara
Home Financials for this Owner
Home Financials are based on the most recent Mortgage that was taken out on this home.
Original Mortgage
$80,000
Interest Rate
5.64%
Mortgage Type
New Conventional
Purchase Details
Closed on
Aug 22, 2005
Sold by
Hoggard Steven W and Hoggard Mary L
Bought by
Spillman Technologies Inc
Home Financials for this Owner
Home Financials are based on the most recent Mortgage that was taken out on this home.
Original Mortgage
$80,000
Interest Rate
5.64%
Mortgage Type
New Conventional
Create a Home Valuation Report for This Property
The Home Valuation Report is an in-depth analysis detailing your home's value as well as a comparison with similar homes in the area
Home Values in the Area
Average Home Value in this Area
Purchase History
| Date | Buyer | Sale Price | Title Company |
|---|---|---|---|
| Harrington & Company | -- | Cache Title Company | |
| Webb Brendon J | -- | Cache Title Company | |
| Webb Brendon J | -- | Cache Title Company | |
| Webb Brendon J | -- | Cache Title Company | |
| Webb Brendon J | -- | Cache Title Company | |
| Spillman Technologies Inc | -- | Cache Title Company |
Source: Public Records
Mortgage History
| Date | Status | Borrower | Loan Amount |
|---|---|---|---|
| Previous Owner | Webb Brendon J | $138,000 | |
| Previous Owner | Webb Brendon J | $80,000 |
Source: Public Records
Tax History
| Year | Tax Paid | Tax Assessment Tax Assessment Total Assessment is a certain percentage of the fair market value that is determined by local assessors to be the total taxable value of land and additions on the property. | Land | Improvement |
|---|---|---|---|---|
| 2025 | $3,366 | $483,265 | $0 | $0 |
| 2023 | $3,221 | $412,970 | $0 | $0 |
| 2022 | $3,266 | $401,240 | $0 | $0 |
| 2021 | $2,962 | $308,406 | $76,320 | $232,086 |
| 2020 | $2,609 | $254,848 | $76,320 | $178,528 |
| 2019 | $1,422 | $237,628 | $59,100 | $178,528 |
| 2018 | $1,353 | $218,500 | $59,100 | $159,400 |
| 2017 | $1,181 | $99,000 | $0 | $0 |
| 2016 | $1,208 | $99,000 | $0 | $0 |
| 2015 | $1,211 | $99,000 | $0 | $0 |
| 2014 | $1,187 | $99,275 | $0 | $0 |
| 2013 | -- | $103,325 | $0 | $0 |
Source: Public Records
Map
Nearby Homes
- 28 N 100 E
- 45 N Center St
- 127 W Main St
- 431 E 100 S
- 828 W 70 N
- 798 W 70 N Unit 85
- 831 W 70 N Unit 91
- 828 W 70 N Unit 87
- 817 W 70 N
- 817 W 70 N Unit 92
- 808 W 70 N Unit 86
- 844 W 70 N Unit 88
- 808 W 70 N
- 350 E 300 N
- 284 W 20 N
- 6 N 400 W
- 325 W 300 N
- 265 S 400 W Unit 2
- 255 S 400 W Unit 1
- 493 Valley View Dr
Your Personal Tour Guide
Ask me questions while you tour the home.